. 1997 Jan 6;185(1):1-11.
doi: 10.1084/jem.185.1.1.

Costimulation of T cell activation by integrin-associated protein (CD47) is an adhesion-dependent, CD28-independent signaling pathway

Affiliations

Costimulation of T cell activation by integrin-associated protein (CD47) is an adhesion-dependent, CD28-independent signaling pathway

M I Reinhold et al. J Exp Med. .

Abstract

The integrin-associated protein (IAP, CD47) is a 50-kD plasma membrane protein with a single extracellular immunoglobulin variable (IgV)-like domain, a multiply membrane-spanning segment, and alternatively spliced short cytoplasmic tails. On neutrophils, IAP has been shown to function in a signaling complex with beta 3 integrins. However, the function of IAP on T cells, which express little or no beta 3 integrin, is not yet defined. Here, we show that mAbs recognizing IAP can enhance proliferation of primary human T cells in the presence of low levels of anti-CD3, but have no effect on T cell proliferation on their own. Together with suboptimal concentrations of anti-CD3, engagement of IAP also enhances IL-2 production in Jurkat cells, an apparently integrin-independent function of IAP. Nonetheless, costimulation by IAP ligation requires cell adhesion. IAP costimulation does not require CD28. Furthermore, anti-IAP, but not anti-CD28, synergizes with suboptimal anti-CD3 to enhance tyrosine phosphorylation of the CD3 zeta chain and the T cell-specific tyrosine kinase Zap70. Ligation of human IAP transfected into the hemoglobin-specific 3.L2 murine T cell hybridoma costimulates activation for IL-2 secretion both with anti-CD3 and with antigenic peptides on antigen-presenting cells (APCs). Moreover, ligation of IAP but not CD28 can convert antagonist peptides into agonists in 3.L2 cells. Using costimulation by IAP ligation as an assay to analyze the structure-function relationships in IAP signaling, we find that both the extracellular and multiply membrane-spanning domains of IAP are necessary for synergy with the antigen receptor, but the alternatively spliced cytoplasmic tails are not. These data demonstrate that IAP ligation initiates an adhesion-dependent costimulatory pathway distinct from CD28. We hypothesize that anti-IAP generates the costimulatory signal because it modulates interactions of the IgV domain with other plasma membrane molecules; this in turn activates effector functions of the multiply membrane-spanning domain of IAP. This model may have general significance for how IAP functions in cell activation.


Figures

Figure 1
Figure 1
Schematic representation of the native and chimeric molecules used in this study. Generation of the individual chimeras is described in Materials and Methods.
Figure 2
Figure 2
IAP synergy with CD3. (A) Human peripheral blood T cells were incubated on plates coated with a low concentration of anti-CD3 together with increasing concentrations of anti-IAP mAb 2E11 or 2D3, or anti-CR1 (3D9). Cells were pulsed with [3H]thymidine for the last 16 h of a 90 h incubation. Shown are averages of triplicate wells from 1 experiment of >3 with similar results. Cells plated on 2E11, 2D3, and 3D9 alone had <1,000 CPM. Maximum stimulation by high concentration of anti-CD3 was 40,000 cpm. (B) Jurkat cells were incubated on plates coated with increasing concentrations of anti-CD3 and the same concentration of anti-IAP (2D3), anti CD28 (9.3), or anti-HLA (W6/32) mAbs. Supernatants were harvested after 24 h and IL-2 concentration measured by assay on CTLL-2 cells. The values shown represent triplicates of [3H]thymidine incorporation by the CTLL-2 cells in 1 experiment of >3 with similar results. Quantitation of IL-2 concentration showed that stimulation of Jurkat cells by low levels of anti CD3 (1) in the presence of anti-IAP or anti-CD28 mAbs led to 1 U/ml, compared with 0.1 U/ml for the negative control mAb. Neither anti-IAP or anti-HLA caused detectable IL-2 secretion in the absence of anti-CD3. Additional mAbs that do not costimulate with anti-CD3 include anti-CD61 (integrin β3), antiCD18 (integrin β2), and anti-CD29 (integrin β1).
Figure 2
Figure 2
IAP synergy with CD3. (A) Human peripheral blood T cells were incubated on plates coated with a low concentration of anti-CD3 together with increasing concentrations of anti-IAP mAb 2E11 or 2D3, or anti-CR1 (3D9). Cells were pulsed with [3H]thymidine for the last 16 h of a 90 h incubation. Shown are averages of triplicate wells from 1 experiment of >3 with similar results. Cells plated on 2E11, 2D3, and 3D9 alone had <1,000 CPM. Maximum stimulation by high concentration of anti-CD3 was 40,000 cpm. (B) Jurkat cells were incubated on plates coated with increasing concentrations of anti-CD3 and the same concentration of anti-IAP (2D3), anti CD28 (9.3), or anti-HLA (W6/32) mAbs. Supernatants were harvested after 24 h and IL-2 concentration measured by assay on CTLL-2 cells. The values shown represent triplicates of [3H]thymidine incorporation by the CTLL-2 cells in 1 experiment of >3 with similar results. Quantitation of IL-2 concentration showed that stimulation of Jurkat cells by low levels of anti CD3 (1) in the presence of anti-IAP or anti-CD28 mAbs led to 1 U/ml, compared with 0.1 U/ml for the negative control mAb. Neither anti-IAP or anti-HLA caused detectable IL-2 secretion in the absence of anti-CD3. Additional mAbs that do not costimulate with anti-CD3 include anti-CD61 (integrin β3), antiCD18 (integrin β2), and anti-CD29 (integrin β1).
Figure 3
Figure 3
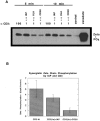
Costimulation with anti-IAP and not anti-CD28 results in enhanced ζ chain and Zap70 tyrosine phosphorylation. (A and C) Jurkat cells (106cells, A; 5 × 10⁶ cells, C) were stimulated for the indicated timepoints with either an optimal high concentration of anti-CD3 (100) or a low concentration of anti-CD3 (1) coimmobilized with anti-IAP, antiHLA, or anti-CD28. Cell lysates were immunoprecipitated with anti-ζ chain (A) or anti-Zap70 (C) polyclonal Abs and analyzed by SDS-PAGE followed by Western blotting with antiphosphotyrosine. (B and D) ζ chain and Zap70 tyrosine phosphorylation expressed as fold increase over control noncostimulatory conditions (low anti-CD3 plus anti-HLA). Bars represent the mean and SEM of three independent experiments at either 5 min (B) or 15 min (D). Phosphorylation of both ζ chain and Zap70 was increased by cell adhesion to the costimulatory combination of anti-CD3 and anti-IAP compared to control and compared with adhesion to antiCD3 and anti-CD28 (P <0.05 in all cases). In contrast, adhesion to the costimulatory combination of anti-CD3 and anti-CD28 did not stimulate ζ chain or Zap70 phosphorylation compared with control.
Figure 3
Figure 3
Costimulation with anti-IAP and not anti-CD28 results in enhanced ζ chain and Zap70 tyrosine phosphorylation. (A and C) Jurkat cells (106cells, A; 5 × 10⁶ cells, C) were stimulated for the indicated timepoints with either an optimal high concentration of anti-CD3 (100) or a low concentration of anti-CD3 (1) coimmobilized with anti-IAP, antiHLA, or anti-CD28. Cell lysates were immunoprecipitated with anti-ζ chain (A) or anti-Zap70 (C) polyclonal Abs and analyzed by SDS-PAGE followed by Western blotting with antiphosphotyrosine. (B and D) ζ chain and Zap70 tyrosine phosphorylation expressed as fold increase over control noncostimulatory conditions (low anti-CD3 plus anti-HLA). Bars represent the mean and SEM of three independent experiments at either 5 min (B) or 15 min (D). Phosphorylation of both ζ chain and Zap70 was increased by cell adhesion to the costimulatory combination of anti-CD3 and anti-IAP compared to control and compared with adhesion to antiCD3 and anti-CD28 (P <0.05 in all cases). In contrast, adhesion to the costimulatory combination of anti-CD3 and anti-CD28 did not stimulate ζ chain or Zap70 phosphorylation compared with control.
Figure 4
Figure 4
hIAP and chimera expression in Jurkat and 3.L2 subclones. Expression of native hIAP and chimeric constructs was determined by staining with mouse anti–hIAP IgG1 (2E11) or rat anti–murine CD8α (dotted lines), or isotype-matched control (7G2 or 313, respectively, solid lines) mAbs as described in Materials and Methods. Shown are profiles of one of the transfected Jurkat or 3.L2 clones, with similar levels of expression in the second clone transfected.
Figure 5
Figure 5
IL-2 production by 3.L2 clones transfected with hIAP form 2. (A) Anti-CD3 was coimmobilized at the indicated concentration with anti-CD28, anti-hIAP (2E11, 2D3), or control mAb (YTS 213.1). 3.L2 clones, transfected with hIAP (form 2) were plated at 1 × 10⁵ cells/well. Supernatants were harvested after 24 h and IL-2 concentration measured as described in Fig. 2 B. (B) 3.L2 clones transfected with hIAP (form 2) at 1 × 10⁵ cells/well were activated with the indicated amounts of Hb(64–76) peptide presented by CH27 cells (2 × 10⁴ cells/well) in the presence of anti-IAP mAbs 2D3 or B6H12, anti CD28 (37.51) or a control mAb (IB4). T cell hybridoma activation was measured by IL-2 production after 24 h of culture as described in Fig. 2 B. Neither anti-IAP or control Ab alone caused detectable IL-2 production. The values shown represent averages of triplicates of 1 experiment of >3 with similar results.
Figure 5
Figure 5
IL-2 production by 3.L2 clones transfected with hIAP form 2. (A) Anti-CD3 was coimmobilized at the indicated concentration with anti-CD28, anti-hIAP (2E11, 2D3), or control mAb (YTS 213.1). 3.L2 clones, transfected with hIAP (form 2) were plated at 1 × 10⁵ cells/well. Supernatants were harvested after 24 h and IL-2 concentration measured as described in Fig. 2 B. (B) 3.L2 clones transfected with hIAP (form 2) at 1 × 10⁵ cells/well were activated with the indicated amounts of Hb(64–76) peptide presented by CH27 cells (2 × 10⁴ cells/well) in the presence of anti-IAP mAbs 2D3 or B6H12, anti CD28 (37.51) or a control mAb (IB4). T cell hybridoma activation was measured by IL-2 production after 24 h of culture as described in Fig. 2 B. Neither anti-IAP or control Ab alone caused detectable IL-2 production. The values shown represent averages of triplicates of 1 experiment of >3 with similar results.
Figure 6
Figure 6
IAP can convert antagonist peptides I72 and A72 to agonists. 3.L2 clones transfected with hIAP form 2 (closed symbol) or IAP/CD7 (open symbol) were activated with the indicated concentration of the Hb(64–76)–I72 (A) or Hb(64–76)–A72 (B) peptide presented by CH27 cells in the presence of anti-IAP mAbs 2E11, 2D3 or B6H12, anti CD28 (37.51), or a control mAb (IB4). I72 and A72 have been shown previously to have significant antagonist but no activating effects on 3.L2 (30). T cell activation was measured as described in Fig. 2 B. The values shown represent averages of triplicates of 1 experiment of >3 with similar results.
Figure 6
Figure 6
IAP can convert antagonist peptides I72 and A72 to agonists. 3.L2 clones transfected with hIAP form 2 (closed symbol) or IAP/CD7 (open symbol) were activated with the indicated concentration of the Hb(64–76)–I72 (A) or Hb(64–76)–A72 (B) peptide presented by CH27 cells in the presence of anti-IAP mAbs 2E11, 2D3 or B6H12, anti CD28 (37.51), or a control mAb (IB4). I72 and A72 have been shown previously to have significant antagonist but no activating effects on 3.L2 (30). T cell activation was measured as described in Fig. 2 B. The values shown represent averages of triplicates of 1 experiment of >3 with similar results.
Figure 7
Figure 7
Anti-IAP costimulates IL-2 production in 3.L2 clones transfected with hIAP form 1. (A) 3.L2 clones, transfected with hIAP form 1, were cultured on surfaces coated with anti-CD3 at the indicated concentration plus anti-CD28 (37.51), anti-hIAP (2E11, 2D3), or control mAb (YTS 213.1) and IL-2 production was measured. (B) 3.L2 clones, transfected with hIAP form 1, were activated with the indicated concentration of Hb(64–76) peptide in the presence of anti-IAP mAbs 2E11, 2D3, or B6H12 or a control mAb (IB4). T cell activation was analyzed as described in Fig. 2 B. The values shown represent averages of triplicates of 1 experiment of >3 with similar results.
Figure 7
Figure 7
Anti-IAP costimulates IL-2 production in 3.L2 clones transfected with hIAP form 1. (A) 3.L2 clones, transfected with hIAP form 1, were cultured on surfaces coated with anti-CD3 at the indicated concentration plus anti-CD28 (37.51), anti-hIAP (2E11, 2D3), or control mAb (YTS 213.1) and IL-2 production was measured. (B) 3.L2 clones, transfected with hIAP form 1, were activated with the indicated concentration of Hb(64–76) peptide in the presence of anti-IAP mAbs 2E11, 2D3, or B6H12 or a control mAb (IB4). T cell activation was analyzed as described in Fig. 2 B. The values shown represent averages of triplicates of 1 experiment of >3 with similar results.
Figure 8
Figure 8
IAP/CD7 cannot costimulate IL-2 production. (A) 3.L2 clones, transfected with IAP/CD7, were plated on plates coated with CD3 at the indicated concentration in the presence of either anti-CD28 (37.51), anti-hIAP (2E11, 2D3), or control mAb (YTS 213.1). (B) IAP/ CD7-transfected 3.L2 clones (open symbol) or hIAP form 2 (closed symbol) were activated with the indicated concentration of Hb(64–76) peptide in the presence of anti-IAP mAbs 2E11, 2D3, or B6H12, or a control mAb (IB4) and T cell activation was analyzed. The values shown represent averages of triplicates of 1 experiment of >3 with similar results.
Figure 8
Figure 8
IAP/CD7 cannot costimulate IL-2 production. (A) 3.L2 clones, transfected with IAP/CD7, were plated on plates coated with CD3 at the indicated concentration in the presence of either anti-CD28 (37.51), anti-hIAP (2E11, 2D3), or control mAb (YTS 213.1). (B) IAP/ CD7-transfected 3.L2 clones (open symbol) or hIAP form 2 (closed symbol) were activated with the indicated concentration of Hb(64–76) peptide in the presence of anti-IAP mAbs 2E11, 2D3, or B6H12, or a control mAb (IB4) and T cell activation was analyzed. The values shown represent averages of triplicates of 1 experiment of >3 with similar results.
Figure 9
Figure 9
The multiply membrane-spanning domain of IAP is not sufficient for T cell costimulation. (A) Jurkat clones, transfected with CD8MC2, were cultured on plates coated with anti-CD3 plus antiCD28 (9.3), anti-IAP (2E11), two different anti-CD8 (YTS, KT15), or control mAb (IB4). Supernatants were harvested after 24 h and IL-2 concentration measured using CTLL-2 as described in Fig. 2 B. A third antiCD8 mAb (53.67) also failed to costimulate these transfected Jurkat cells. (B) 3.L2 clones transfected with CD8MC2 (open symbols) or hIAP form 2 (closed symbol) were activated by the indicated amounts of Hb(64-76) peptide presented by CH27 cells in the presence of anti-IAP (2D3), antiCD8 (53.67; KT15; YTS), or control (anti-KLH) mAb and IL-2 production was measured. The values represent averages of triplicates of 1 experiment of >3 with similar results.
Figure 9
Figure 9
The multiply membrane-spanning domain of IAP is not sufficient for T cell costimulation. (A) Jurkat clones, transfected with CD8MC2, were cultured on plates coated with anti-CD3 plus antiCD28 (9.3), anti-IAP (2E11), two different anti-CD8 (YTS, KT15), or control mAb (IB4). Supernatants were harvested after 24 h and IL-2 concentration measured using CTLL-2 as described in Fig. 2 B. A third antiCD8 mAb (53.67) also failed to costimulate these transfected Jurkat cells. (B) 3.L2 clones transfected with CD8MC2 (open symbols) or hIAP form 2 (closed symbol) were activated by the indicated amounts of Hb(64-76) peptide presented by CH27 cells in the presence of anti-IAP (2D3), antiCD8 (53.67; KT15; YTS), or control (anti-KLH) mAb and IL-2 production was measured. The values represent averages of triplicates of 1 experiment of >3 with similar results.

References

    1. Brown EJ, Hooper L, Ho T, Gresham HD. Integrin-associated protein: a 50-kD plasma membrane antigen physically and functionally associated with integrins. J Cell Biol. 1990;111:2785–2794. - PMC - PubMed
    1. Lindberg FP, Lublin DM, Telen MJ, Veile RA, Miller YE, Donis-Keller H, Brown EJ. Rh-related antigen CD47 is the signal-transducer Integrin-associated protein. J Biol Chem. 1994;269:1567–1570. - PubMed
    1. Senior RM, Gresham HD, Griffin GL, Brown EJ, Chung AE. Entactin stimulates neutrophil adhesion and chemotaxis through interactions between its Arg–Gly– Asp (RGD) domain and the leukocyte response integrin (LRI) J Clin Invest. 1992;90:2251–2257. - PMC - PubMed
    1. Schwartz MA, Brown EJ, Fazeli B. A 50 kDa integrin-associated protein is required for integrin-regulated calcium entry in endothelial cells. J Biol Chem. 1993;268:19931–19934. - PubMed
    1. Cooper D, Lindberg FP, Gamble JR, Brown EJ, Vadas MA. The transendothelial migration of neutrophils involves Integrin-associated protein (CD47) Proc Natl Acad Sci USA. 1995;92:3978–3982. - PMC - PubMed

Publication types

MeSH terms