. 1997 Jan 6;185(1):121-30.
doi: 10.1084/jem.185.1.121.

Replacement of pre-T cell receptor signaling functions by the CD4 coreceptor

Affiliations

Replacement of pre-T cell receptor signaling functions by the CD4 coreceptor

A M Norment et al. J Exp Med. .

Abstract

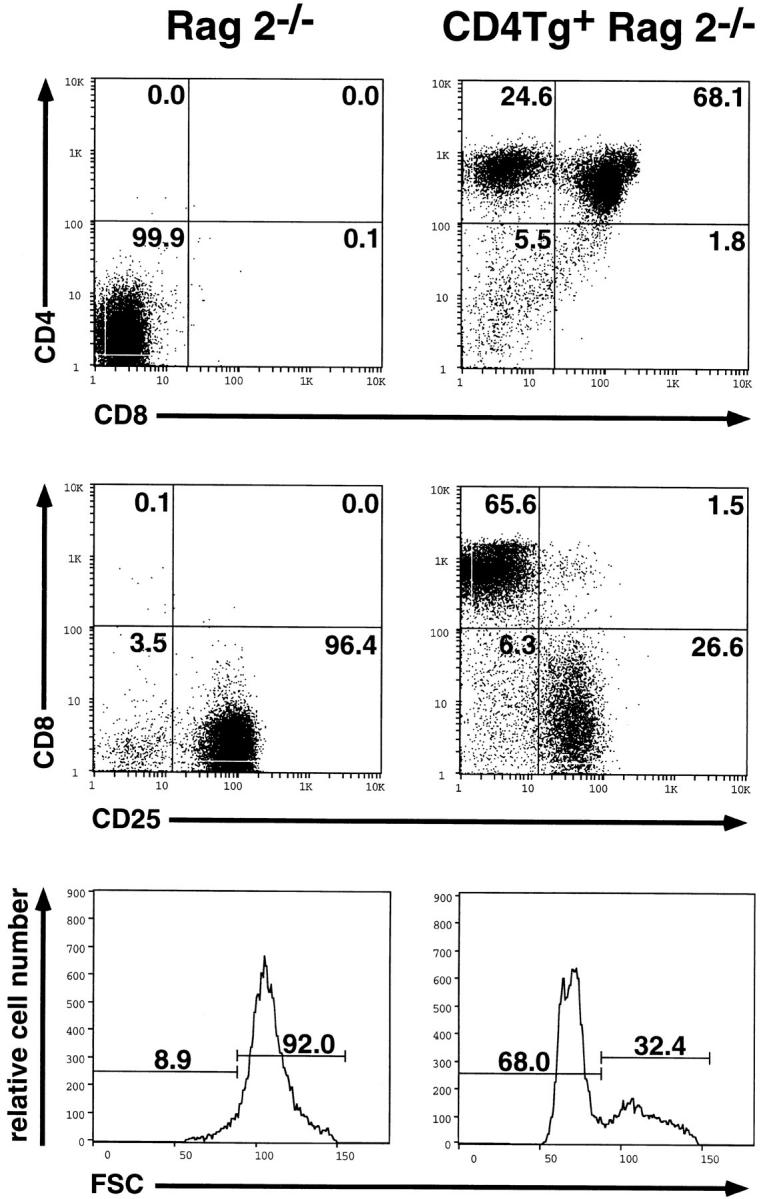
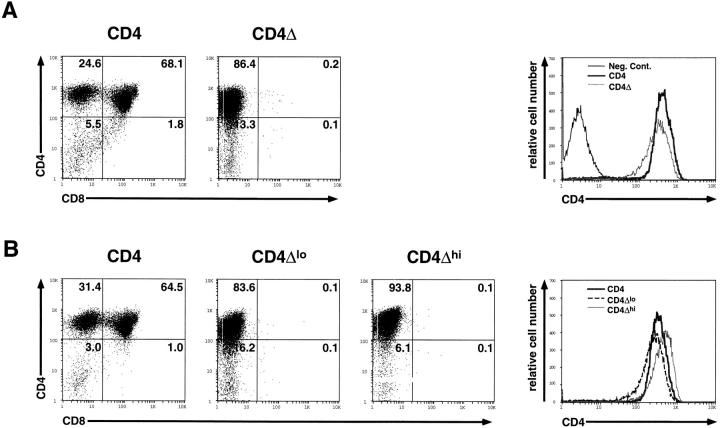
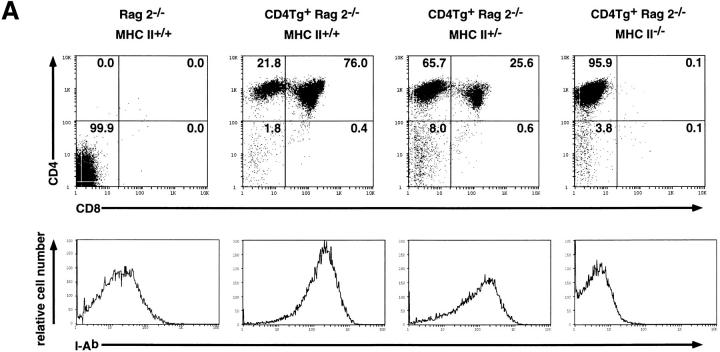
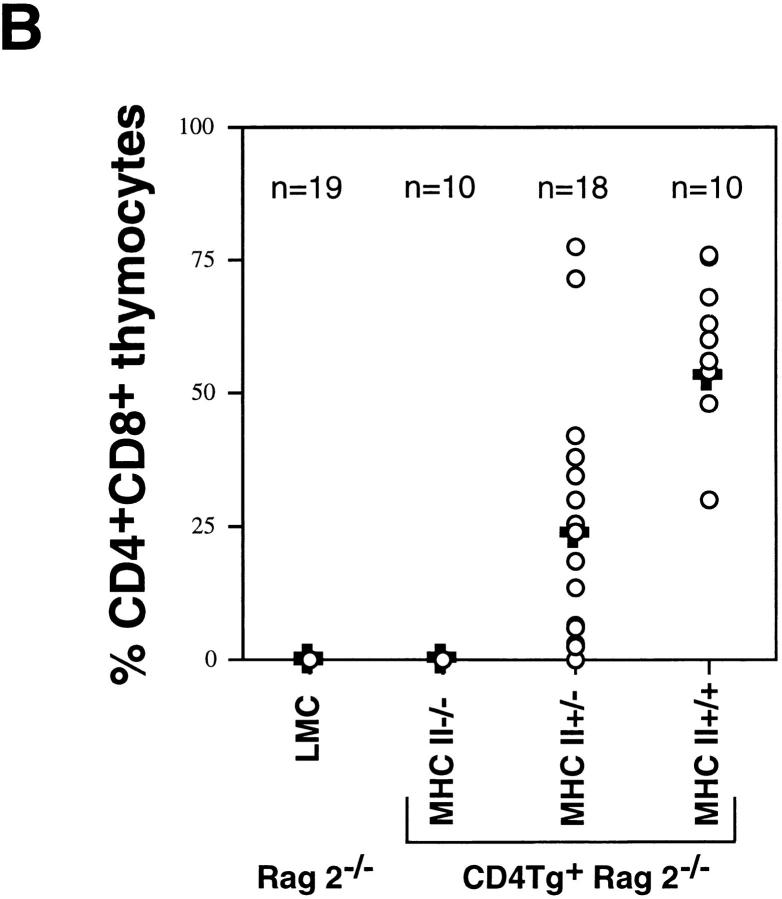
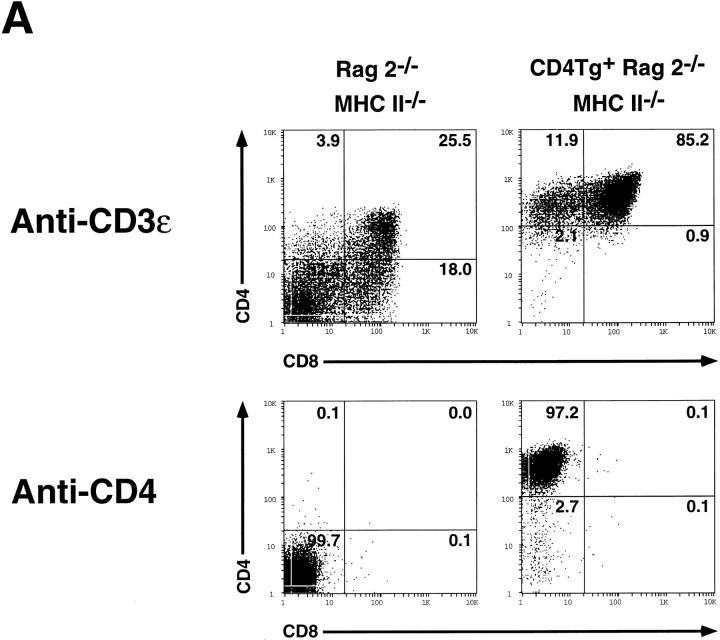
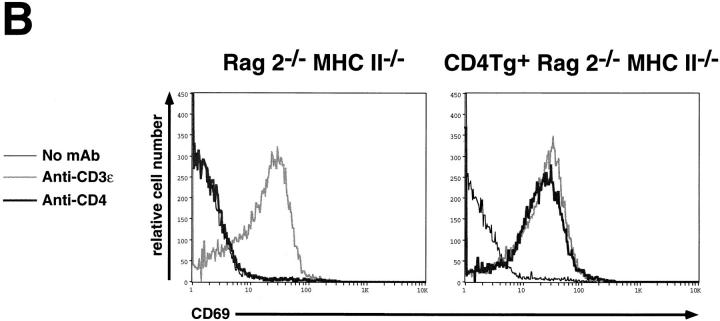
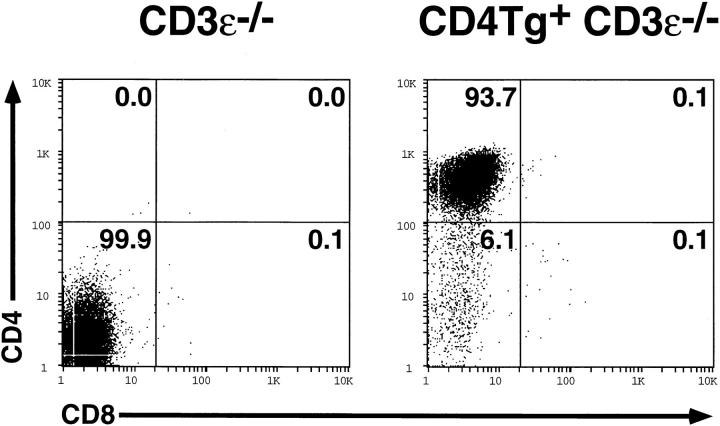
An important checkpoint in early thymocyte development ensures that only thymocytes with an in-frame T cell receptor for antigen beta (TCR-beta) gene rearrangement will continue to mature. Proper assembly of the TCR-beta chain into the pre-TCR complex delivers signals through the src-family protein tyrosine kinase p56lck that stimulate thymocyte proliferation and differentiation to the CD4+CD8+ stage. However, the biochemical mechanisms governing p56lck activation remain poorly understood. In more mature thymocytes, p56lck is associated with the cytoplasmic domain of the TCR coreceptors CD4 and CD8, and cross-linking of CD4 leads to p56lck activation. To study the effect of synchronously inducing p56lck activation in immature CD4-CD8- thymocytes, we generated mice expressing a CD4 transgene in Rag2-/- thymocytes. Remarkably, without further experimental manipulation, the CD4 transgene drives maturation of Rag2-/- thymocytes in vivo. We show that this process is dependent upon the ability of the CD4 transgene to bind Lck and on the expression of MHC class II molecules. Together these results indicate that binding of MHC class II molecules to CD4 can deliver a biologically relevant, Lck-dependent activation signal to thymocytes in the absence of the TCR-alpha or -beta chain.


Figures

Figure 1
Figure 1
Flow cytometric analysis of thymocytes from Rag2−/− and CD4 transgenic Rag2−/− mice. Two parameter fluorescence histograms of lymphocyte gated events are shown after cell surface staining of thymocytes from age matched mice with anti-CD4-PE and anti-CD8-FITC (top), or anti-CD8-PE and anti-CD25-FITC (middle). Forward light scatter profiles (FSC) are also shown (bottom) as an indication of relative cell size. The percentage of cells in each population is indicated. Under identical staining conditions, wild-type CD4+ thymocytes lie at ∼100 units on the logarithmic scale.
Figure 2
Figure 2
Flow cytometric analysis of thymocytes from wild-type CD4Tg+ Rag2−/− and tailless CD4Δ Rag2−/− transgenic mice. (A) Representative fluorescence staining profiles of CD4 and CD8 are shown for thymocytes from age matched CD4Tg+ Rag2−/− mice (CD4, left panel) or tailless CD4 (CD4Δ, middle panel) Rag2−/− mice (n = 6). A single parameter histogram better shows the relative levels of CD4 expression (right panel) for these mice as compared to a transgene negative littermate control of CD4Δ (Neg. Cont.). (B) A similar immunofluorescense analysis is shown for thymocytes from a CD4Tg+ Rag2−/− mouse (left panel), and two of seven CD4Δ Rag2−/− positive progeny from a CD4Δ × CD4Δ mating (middle two panels). Two parameter fluorescence profiles are shown for wild-type CD4Tg+ and the mice expressing the lowest (CD4Δlo) and highest (CD4Δhi) level of CD4Δ in the litter. The relative levels of CD4 expression are again shown by a single parameter histogram (right panel). The percentage of cells in each population is indicated. While some CD4Δ Rag2−/− mice (7/21 analyzed) contained a very small fraction of CD8+CD25 thymocytes (1–2%), this did not correlate with the level of CD4Δ expression. The relative percentage of CD8+CD25 thymocytes in wild-type CD4 Rag 2−/−/CD4Δ Rag 2−/− mice was >50fold.
Figure 3
Figure 3
Flow cytometric analysis of thymocytes from CD4Tg+ Rag2−/− mice mated onto an MHC class II−/− background. (A) Fluorescence staining profiles of CD4 and CD8 (top panels) or the MHC class II molecule I-Ab (bottom panels) of thymocytes from a CD4 transgene negative MHC class II wild-type control (Rag2 / MHC II +/+) and CD4 transgene positive littermates that are wild-type (CD4Tg + Rag2 / MHC II +/+), heterozygous (CD4Tg + Rag2 / MHC II +/) or null (CD4Tg + Rag2 / MHC II /) for MHC class II expression. The percentage of cells in each population is indicated. Unlike thymi from CD4Tg+ Rag2−/− mice that were first analyzed (Fig. 1), thymi from the crosses of CD4Tg+ Rag2−/− mice with MHC class II−/− mice did not exhibit an increase in cell number relative to CD4 transgene negative littermates. This was observed even in CD4Tg+ Rag2−/− MHC class II+/+ progeny of MHC class II heterozygote crosses. This is likely due to nonspecific changes in genetic background. (B) Scatter graph of the percentage of CD4+CD8+ thymocytes from the progeny of CD4Tg+ Rag2−/− × MHC class II−/− matings. Each circle shows a data point from an individual mouse, with the mean represented by a bold plus sign (+). The number of mice analyzed for each type is indicated across the top of the graph. CD4 transgene negative littermate controls (LMC) included MHC class II null, heterozygous and wild-type mice.
Figure 3
Figure 3
Flow cytometric analysis of thymocytes from CD4Tg+ Rag2−/− mice mated onto an MHC class II−/− background. (A) Fluorescence staining profiles of CD4 and CD8 (top panels) or the MHC class II molecule I-Ab (bottom panels) of thymocytes from a CD4 transgene negative MHC class II wild-type control (Rag2 / MHC II +/+) and CD4 transgene positive littermates that are wild-type (CD4Tg + Rag2 / MHC II +/+), heterozygous (CD4Tg + Rag2 / MHC II +/) or null (CD4Tg + Rag2 / MHC II /) for MHC class II expression. The percentage of cells in each population is indicated. Unlike thymi from CD4Tg+ Rag2−/− mice that were first analyzed (Fig. 1), thymi from the crosses of CD4Tg+ Rag2−/− mice with MHC class II−/− mice did not exhibit an increase in cell number relative to CD4 transgene negative littermates. This was observed even in CD4Tg+ Rag2−/− MHC class II+/+ progeny of MHC class II heterozygote crosses. This is likely due to nonspecific changes in genetic background. (B) Scatter graph of the percentage of CD4+CD8+ thymocytes from the progeny of CD4Tg+ Rag2−/− × MHC class II−/− matings. Each circle shows a data point from an individual mouse, with the mean represented by a bold plus sign (+). The number of mice analyzed for each type is indicated across the top of the graph. CD4 transgene negative littermate controls (LMC) included MHC class II null, heterozygous and wild-type mice.
Figure 4
Figure 4
Flow cytometric analysis of thymocytes from control and CD4Tg+ Rag2−/− MHC class II−/− littermates treated with anti-CD3ε or anti-CD4 mAb. (A) 4-wk-old mice were treated intraperitoneally with 100 μg of the anti-CD3ε mAb 2C11 (top panels), or 20 μg of the antiCD4 mAb GK1.5 (bottom panels). After 4 d, thymocytes were stained and analyzed by flow cytometry using anti-CD4-PE and anti-CD8-FITC. Identical results were obtained for CD4Tg+ Rag2−/− MHC II−/− mice treated with 100 μg or 500 μg GK1.5. The percentage of cells in each population is indicated. Total thymocyte numbers were as follows: anti-CD3ε–treated Rag2−/− MHC II−/− (1.2 × 10⁷) or CD4 Rag2−/− MHC II−/− mice (3.2 × 10⁷). (B) Single parameter fluorescence histograms show CD69 expression 20 h after treatment with 150 μg of mAb 2C11 (gray line) or GK1.5 (thick black line) as compared to untreated controls (thin black line).
Figure 4
Figure 4
Flow cytometric analysis of thymocytes from control and CD4Tg+ Rag2−/− MHC class II−/− littermates treated with anti-CD3ε or anti-CD4 mAb. (A) 4-wk-old mice were treated intraperitoneally with 100 μg of the anti-CD3ε mAb 2C11 (top panels), or 20 μg of the antiCD4 mAb GK1.5 (bottom panels). After 4 d, thymocytes were stained and analyzed by flow cytometry using anti-CD4-PE and anti-CD8-FITC. Identical results were obtained for CD4Tg+ Rag2−/− MHC II−/− mice treated with 100 μg or 500 μg GK1.5. The percentage of cells in each population is indicated. Total thymocyte numbers were as follows: anti-CD3ε–treated Rag2−/− MHC II−/− (1.2 × 10⁷) or CD4 Rag2−/− MHC II−/− mice (3.2 × 10⁷). (B) Single parameter fluorescence histograms show CD69 expression 20 h after treatment with 150 μg of mAb 2C11 (gray line) or GK1.5 (thick black line) as compared to untreated controls (thin black line).
Figure 5
Figure 5
Flow cytometric analysis of thymocytes from CD3ε−/− (left panel) or CD4 transgene-bearing CD3ε−/− (right panel) littermates. The percentage of cells in each population is indicated.

References

    1. Perlmutter RM, Levin SD, Appleby MW, Anderson S J, Alberola-Ila J. Regulation of lymphocyte function by protein phosphorylation. Ann Rev Immunol. 1993;11:451–499. - PubMed
    1. Jenkinson EJ, Owen JJ. T-cell differentiation in thymus organ cultures. Semin Immunol. 1990;2:51–58. - PubMed
    1. Saint-Ruf C, Ungewiss K, Groettrup M, Bruno L, Fehling HJ, von Boehmer H. Analysis and expression of a cloned pre-T cell receptor gene. Science (Wash DC) 1994;266:1208–1212. - PubMed
    1. Levelt CN, Carsetti R, Eichmann K. Regulation of thymocyte development through CD3. II. Expression of T cell receptor β CD3ε and maturation to the CD4+8+stage are highly correlated in individual thymocytes. J Exp Med. 1993;178:1867–1875. - PMC - PubMed
    1. Groettrup M, Baron A, Griffiths G, Palacios R, von Boehmer H. T cell receptor (TCR) β chain homodimers on the surface of immature but not mature α, γ, δ chain deficient T cell lines. EMBO (Eur Mol Biol Organ) J. 1992;11:2735–2746. - PMC - PubMed

Publication types

MeSH terms