. 1997 Feb 15;17(4):1435-46.
doi: 10.1523/JNEUROSCI.17-04-01435.1997.

A pacemaker current in dye-coupled hilar interneurons contributes to the generation of giant GABAergic potentials in developing hippocampus

Affiliations

A pacemaker current in dye-coupled hilar interneurons contributes to the generation of giant GABAergic potentials in developing hippocampus

F Strata et al. J Neurosci. .

Abstract

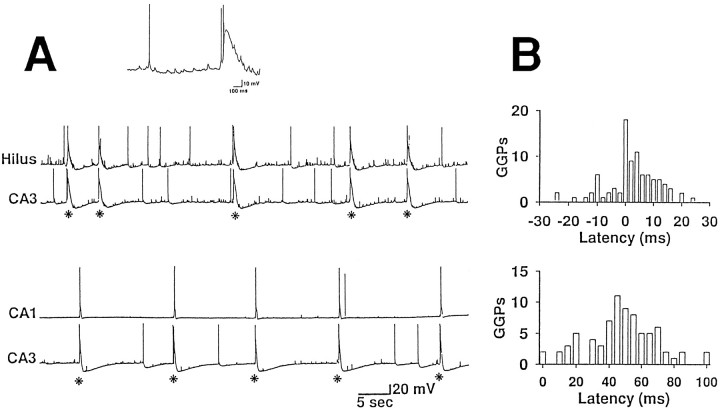
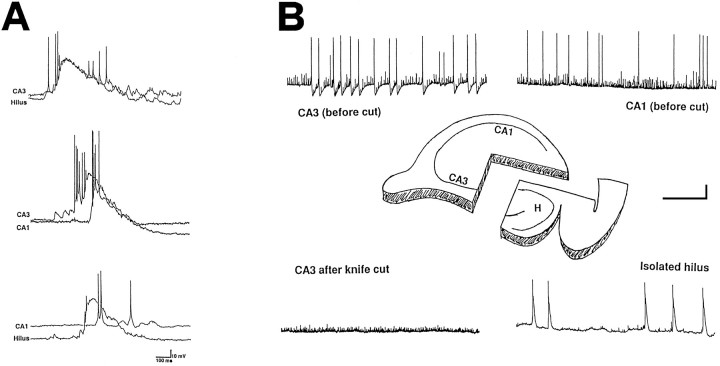
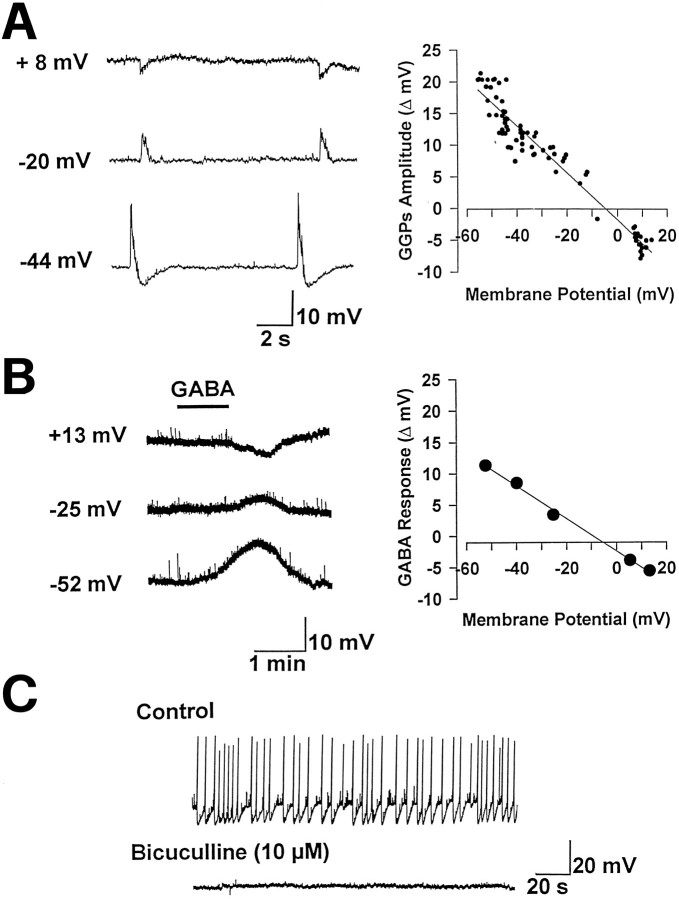
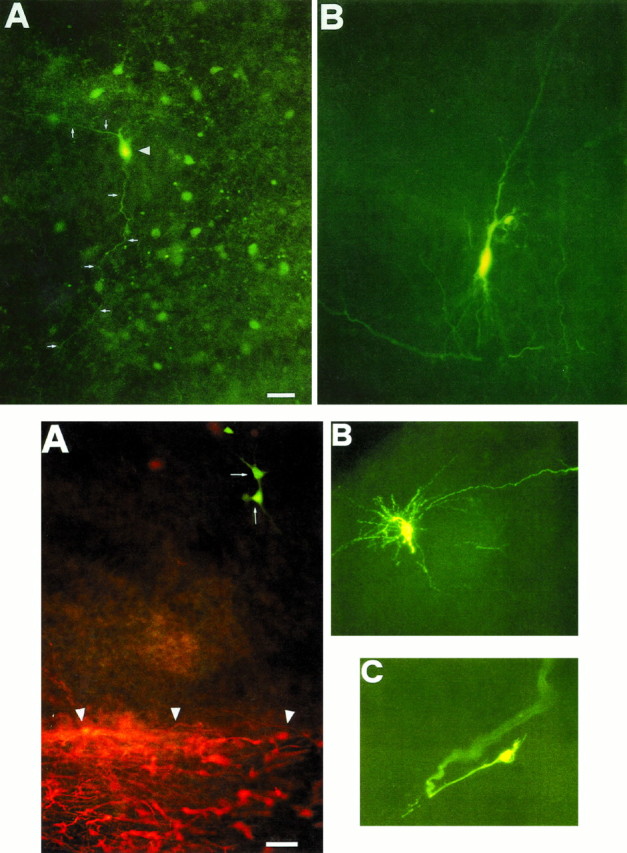
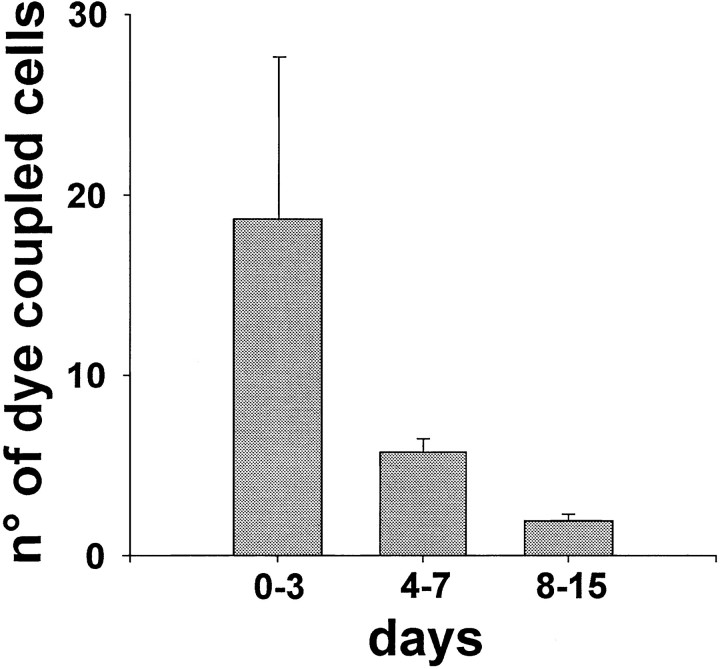
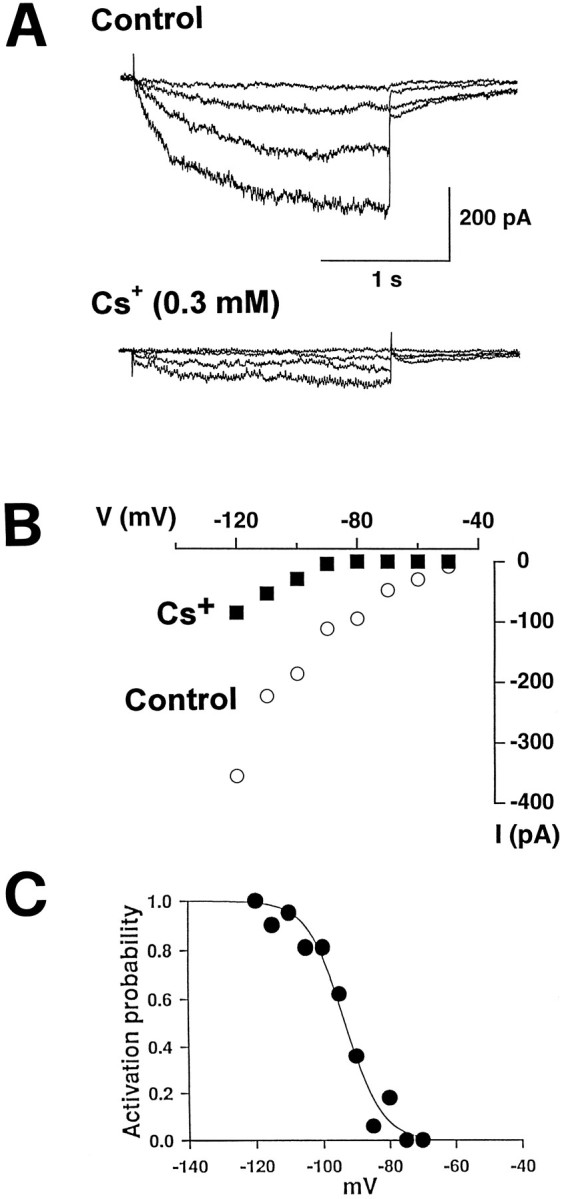
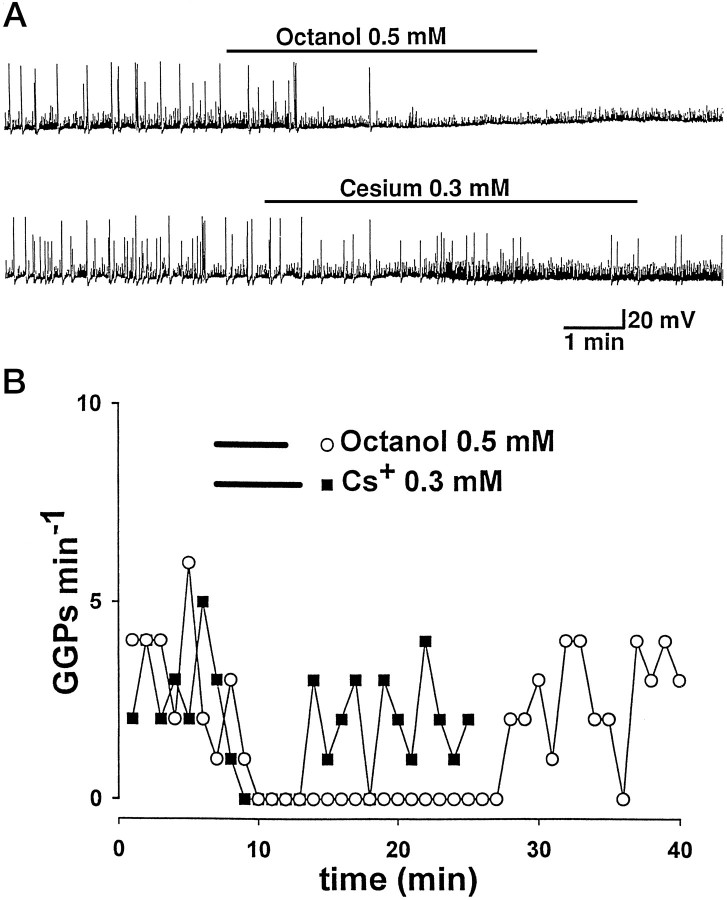
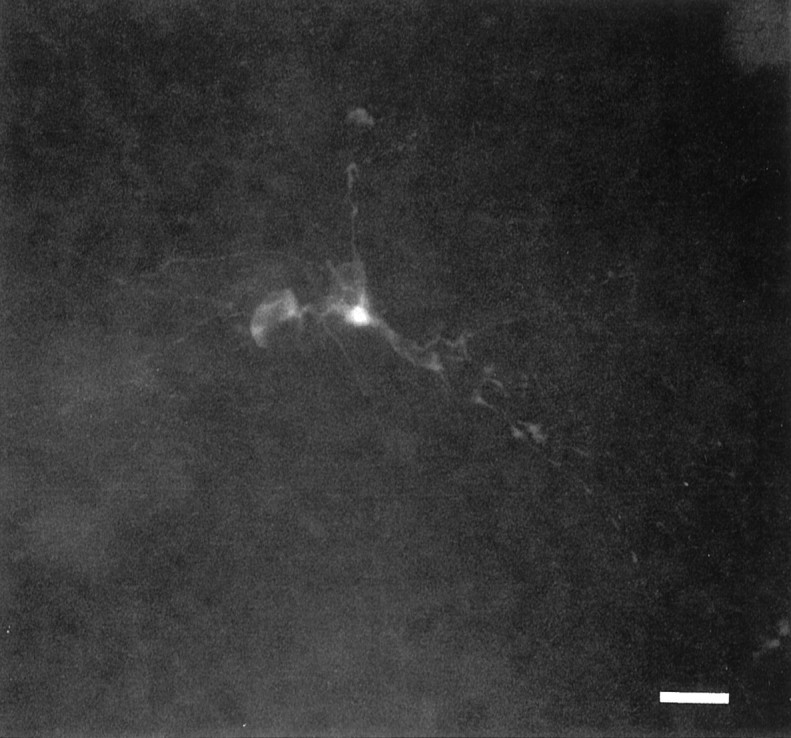
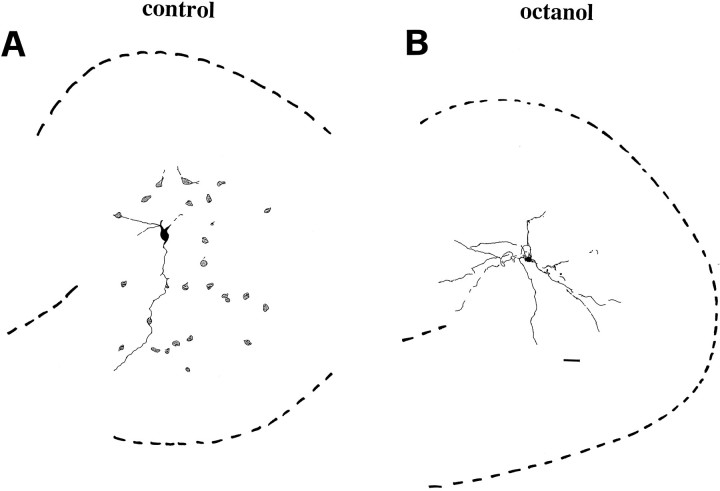
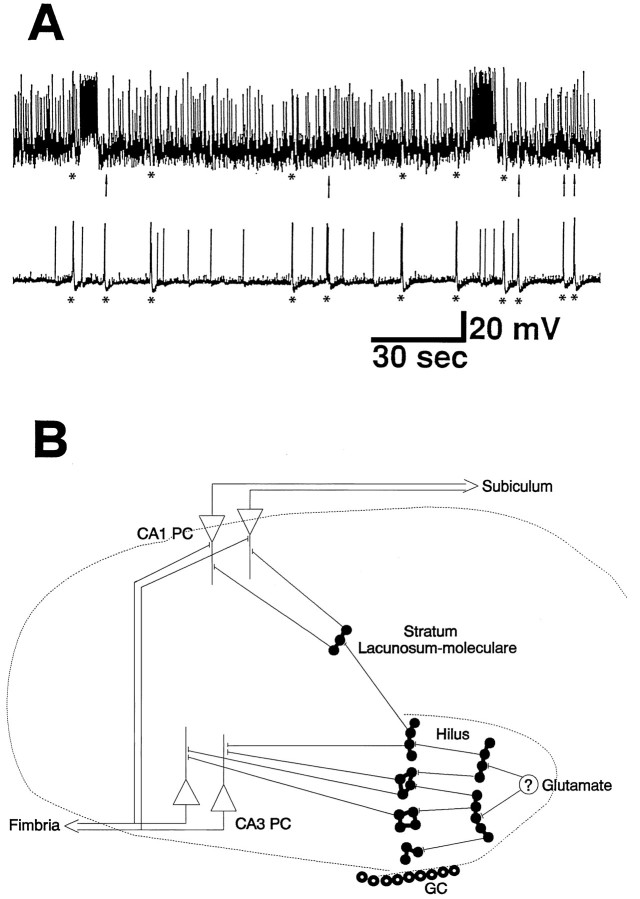
The establishment of synaptic connections and their refinement during development require neural activity. Increasing evidence suggests that spontaneous bursts of neural activity within an immature network are mediated by gamma-aminobutyric acid via a paradoxical excitatory action. Our data show that in the developing hippocampus such synchronous burst activity is generated in the hilar region by transiently coupled cells. These cells have been identified as neuronal elements because they fire action potentials and they are not positive for the glial fibrillary acidic protein staining. Oscillations in hilar cells are "paced" by a hyperpolarization-activated current, with properties of Ih. Coactivated interneurons synchronously release GABA, which via its excitatory action may serve a neurotrophic function during the refinement of hippocampal circuitry.


Figures

Fig. 1.
Fig. 1.
Correlation between GGPs occurring in different hippocampal subfields. A, Pair of recordings obtained at P4 from a hilar interneuron and a CA3 pyramidal neuron and from two pyramidal neurons of the CA3 and CA1 subfields. A single GGP is shown in the inset above the traces and marked by anasterisk in the traces. B, Cross-correlation histograms obtained from pairs of recordings shown inA. The top histogram (hilus taken as reference) has a narrow peak centered at zero (20% of the events) and a broader distribution grouped within 15 msec (51% of the events). Number of events, 90; bin width, 2 msec. In the bottomhistogram GGPs in CA1 are plotted as a function of the time after the event recorded from CA3. Number of events, 77; bin width, 5 msec.
Fig. 2.
Fig. 2.
Giant GABAergic potentials were detected in the isolated hilus. A, Pairs of GGPs recorded from different hippocampal fields are superimposed. It can be observed that GGPs recorded in the hilus and CA3 region are almost synchronous, whereas those detected in the CA3–CA1 or hilus–CA1 occur with a latency of several milliseconds (also see text). B, Schematic representation of the experimental condition before and after isolation of the hilus by knife cut. GGPs were detected before the cut either in the CA3 (top left trace) or in the CA1 (top right trace) fields. After the knife cut, GGPs were still detected in the hilus (H, bottom right trace), whereas they were not detected either in CA3 (bottom left trace) or in CA1 fields (data not shown). Scale bars: 20 mV vertical; 30 sec horizontal, except for the bottom right trace, which is 6 sec.
Fig. 3.
Fig. 3.
GGPs in the hilus are GABAA-mediated.A, Traces showing spontaneously occurring GGPs (recorded with a KCl-containing microelectrode from a hilar cell at P2) at different membrane potentials. On the right, the amplitude of GGPs is plotted versus the membrane potential. Data points are fit with a regression line. B, Responses to exogenously applied GABA (200 μm) in the presence of TTX (1 μm) at different potentials (left), obtained from the same neuron. On theright, the amplitude of the responses is plotted against the membrane potential. As indicated by the regression line, the reversal of GABA responses is very close to that obtained for GGPs. C, GGPs are abolished by bicuculline (10 μm).
Fig. 4.
Fig. 4.
Top. Biocytin-injected hilar interneuron, but not pyramidal cell, reveals surrounding cells. A, P3 hilar cells in a 50 μm hippocampal slice. The injected interneuron (arrowhead) is coupled to a cluster of surrounding cells. Two neuronal processes (white arrows) connect neighboring cells. B, Staining of a single CA3 pyramidal neuron. Scale bar, 44 μm.
Fig. 6.
Fig. 6.
Dye coupling is developmentally regulated. Histogram shows the developmental disappearance of dye coupling. The number of dye-coupled cells was significantly (p < 0.05) reduced when biocytin was injected in older animals.
Fig. 7.
Fig. 7.
Hilar interneurons bear a pacemaker current.A, Traces showing an inward current activated by 20, 40, 60, and 80 mV hyperpolarizing voltage steps (2 sec duration) from a holding potential of −40 mV before (above) and during (below) bath application of Cs+ (0.3 mm). B, I–V relationship for the cell shown in A before and during application of Cs+. C, Steady-state activation curve. Data points were fit by a two-state Boltzmann distribution.
Fig. 8.
Fig. 8.
The inward rectifier “paces” GGPs.A, Spontaneous GABAergic bursts in a CA3 pyramidal neuron at P3 (top trace) and in a hilar interneuron at P4 (bottom trace). Resting membrane potentials are −68 mV in the pyramidal cell and −59 mV in the hilar interneurons. Octanol slightly depolarized the membrane and reversibly inhibited GGPs. Cs+ blocked GGPs as well. B, Time course of the GGPs frequency for the cells shown in A before, during (see bars in inset), and after application of drugs.
Fig. 9.
Fig. 9.
Octanol restricts interneurons cluster size. When biocytin was injected in a P3 hilar cell in the presence of octanol 0.5 mm, only one cell was observed. Scale bar, 60 μm.
Fig. 10.
Fig. 10.
Camera lucida drawings of coupled and uncoupled hilar cells. A, The cluster of hilar neurons shown in Figure 4A is compared with the cell of Figure 9injected in the presence of octanol (0.5 mm; B). Scale bar: A, 44 μm; B, 60 μm.
Fig. 11.
Fig. 11.
A simplified model of bursting generation and propagation. Paired intracellular recording of a morphologically identified hilar mossy cell (top trace, holding potential −61 mV) and a CA3 pyramidal neuron (−60 mV) from a P5 rat. Some GGPs (asterisks) were observed in both cells, but others were not detected in the mossy cell (arrows). Note the long-lasting spontaneous burst of action potential in the mossy cell. Because the mossy cell releases glutamate (Scharfman, 1993), this prolonged depolarization might provide the glutamatergic input to the surrounding coupled interneurons, priming the cascade of amplification as shown in B. The first group of coactive interneurons driven by the mossy cell would release GABA and then recruit a larger number of clusters of coupled interneurons. The enhancement in [K+]o evoked by GABA-mediated depolarization (Barolet and Morris, 1991) associated with a poorly developed [K+]o sequestering system (Konietzko and Müller, 1994) may facilitate the spread of the excitation throughout the whole hippocampus. Then the mossy cell is recruited again by GGPs that arose elsewhere.

References

    1. Altman J, Bayer SA. Migration and distribution of two populations of hippocampal granule cell precursors during the perinatal and postnatal periods. J Comp Neurol. 1990;301:365–381. - PubMed
    1. Amaral DG. A Golgi study of cell types in the hilar region of the hippocampus in the rat. J Comp Neurol. 1978;182:851–914. - PubMed
    1. Andersen P, Bliss VP, Skrede KK. Lamellar organization of hippocampal excitatory pathways. Exp Brain Res. 1971;13:222–238. - PubMed
    1. Angstadt JD, Calabrese RL. A hyperpolarization-activated inward current in heart interneurons of the medicinal leech. J Neurosci. 1989;9:2846–2857. - PMC - PubMed
    1. Barbin G, Pollard H, Gaiarsa JL, Ben Ari Y. Involvement of GABAA receptors in the outgrowth of cultured hippocampal neurons. Neurosci Lett. 1993;152:150–154. - PubMed

Publication types