. 1997 Feb 15;17(4):1481-92.
doi: 10.1523/JNEUROSCI.17-04-01481.1997.

Prism adaptation of reaching movements: specificity for the velocity of reaching

Affiliations

Prism adaptation of reaching movements: specificity for the velocity of reaching

S Kitazawa et al. J Neurosci. .

Abstract

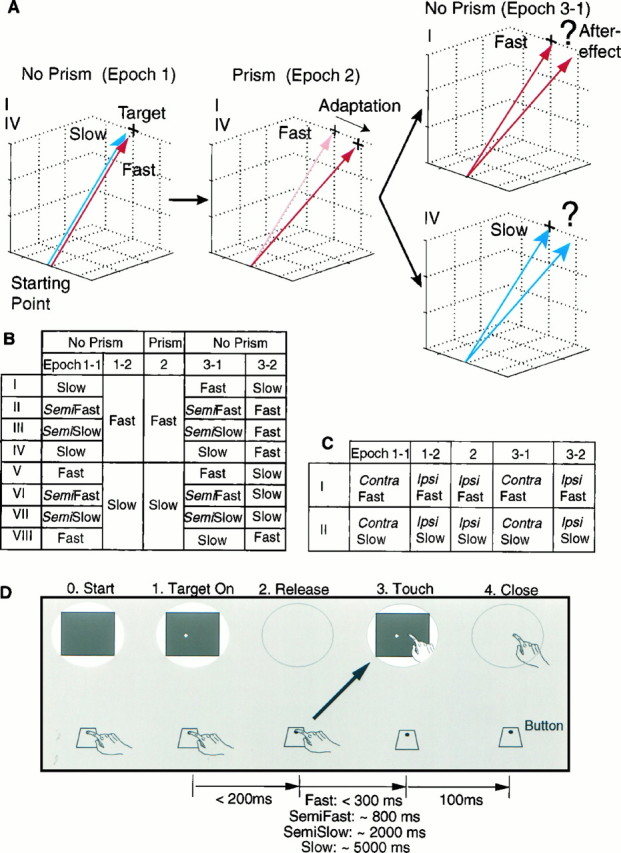
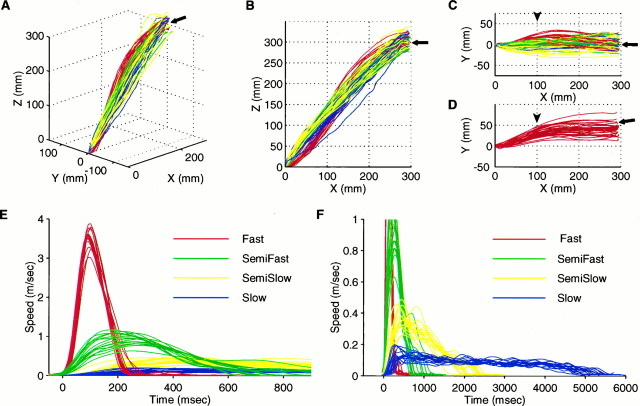
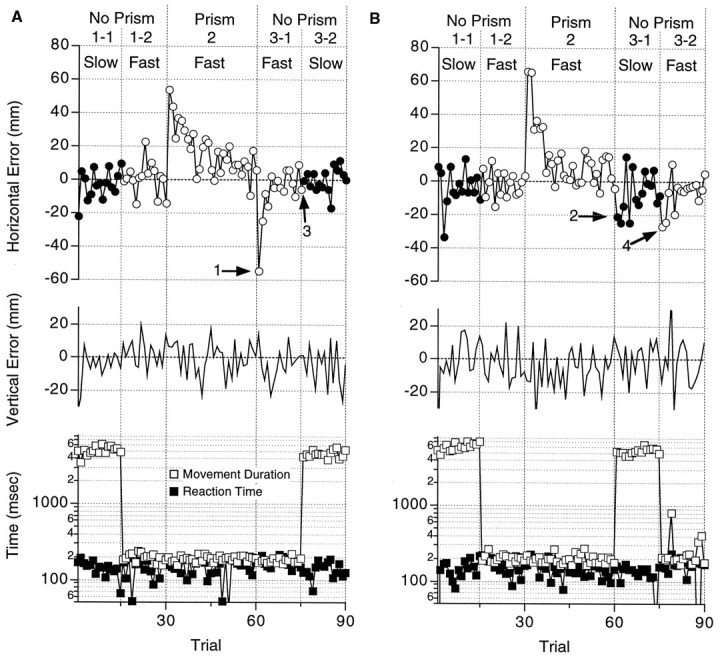
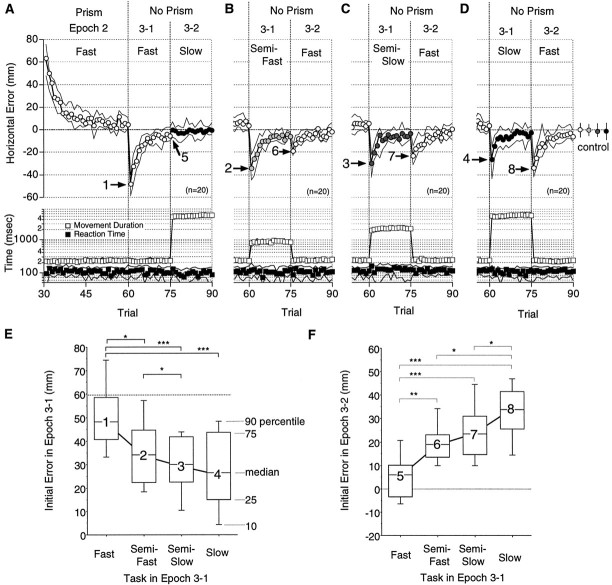
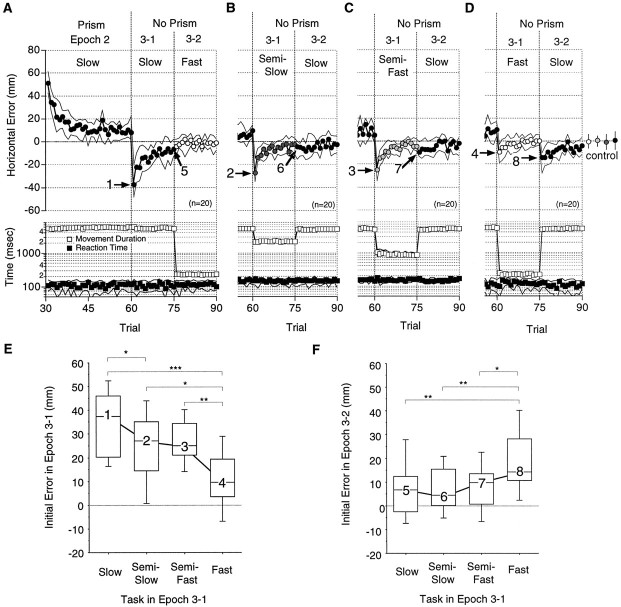
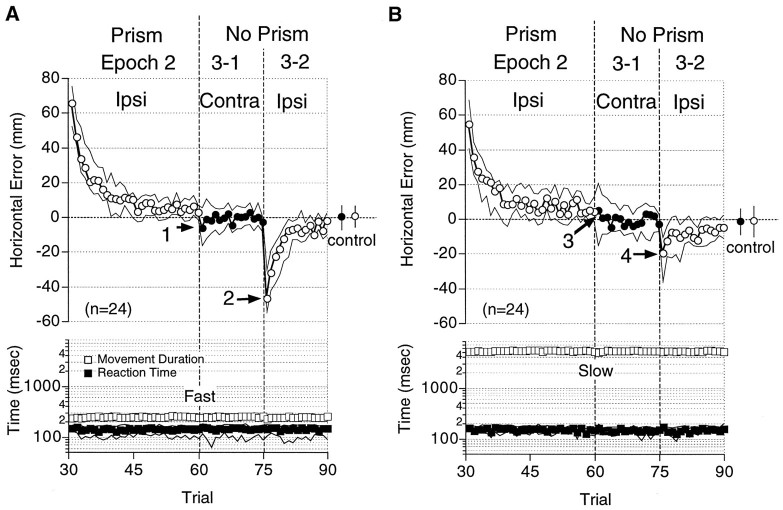
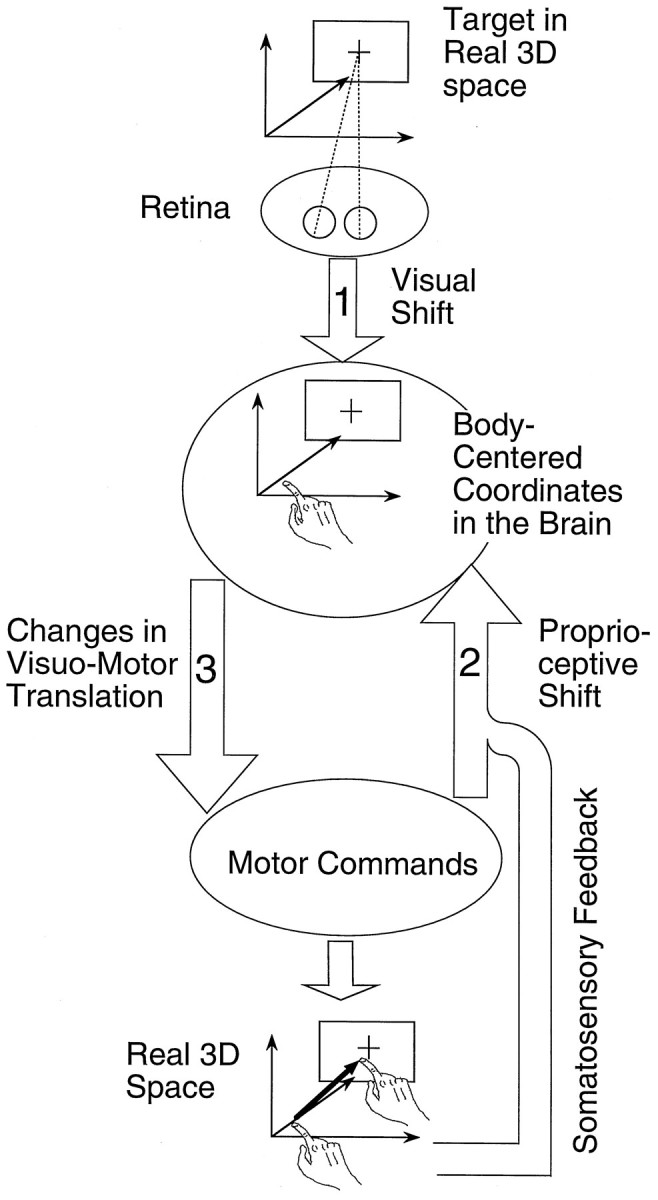
Accurate reaching toward a visual target is disturbed after the visual field is displaced by prisms but recovers with practice. When the prisms are removed, subjects misreach in the direction opposite to the prism displacement (aftereffect). The present study demonstrated that the severity of the aftereffect depends on the velocity of the movements during and after the visual displacement. Trained subjects were required to reach with one of four movement durations (<300, approximately 800, approximately 2000, and approximately 5000 msec) from a fixed starting point to a target that appeared at a random location on a tangent screen (400 mm away). The size of the aftereffect was largest when the movement after the removal was performed with the same duration as that performed with the prisms. It became smaller as the difference in velocity became larger. When the contralateral arm was used after visual displacement, the aftereffect was never significant. Because the adaptation does not generalize across velocities or to the other arm, we infer that the underlying changes occur at a later stage in the transformation from visual input to motor output, in which not only the direction but also the time-dependent parameters of movements, such as velocity, acceleration or force, are represented.


Figures

Fig. 1.
Fig. 1.
Design of experiments. A, General concept, taking conditions I and IV in B as examples. The subject is required to make slow (blue arrow) and fast (red arrow) reaching movements to a target without prisms inEpoch 1. Then the visual field is displaced to theleft by prisms in Epoch 2, during which the subject is required to make the fast reaching movements. The subject initially reaches to the position of the virtual image of the target (gray cross) but, after practice, reaches to the position of the real target (solid cross, Adaptation). InEpoch 3-1, when the prisms are removed, the subject is required to execute the fast reaching movements in one condition (I) and the slow reaching movements in another (IV). B, Eight conditions (I–VIII) of four reaching movements (Fast, Semifast, Semislow, and Slow) that required movement durations of <300, ∼800, ∼2000, and ∼5000 msec, respectively. One experiment consisted of 90 trials: 15, 15, 30, 15, and 15 trials for Epoch 1-1, 1-2, 2, 3-1, and 3-2, respectively. In Epoch 2, the visual field was displaced to the left or to the right by 15-diopter wedge prisms. The prisms were removed for the last Epochs (No Prism). C, Intermanual transfer of adaptation acquired with fast (I) and slow (II) reaching movements of the ipsilateral arm (Ipsi) to the contralateral arm (Contra). D, Time sequence of one trial. Each column schematically shows the status of the visual field (oval shape) and the position of the hand relative to the button and the screen. Shutters opened at 0(Start), when the subject pressed the button. A target appeared after beeps at a random location in a square area (40 mm × 40 mm) on the screen (1, Target On). Vision was blocked from 2 (Release) to 3(Touch) and allowed again for 100 msec immediately after the touch.
Fig. 2.
Fig. 2.
Trajectories (A–D) and tangential velocity profiles (E, F) of the hand (tip of the index finger) during the four task movements. Red, green, yellow, and blue traces show data for the fast, semifast, semislow, and slow reaching tasks, respectively. All data were obtained from subject TY. A–C, Three-dimensional display (A), lateral view (B), and top view (C) of the hand trajectories in Epoch 1. Fifteen traces for each of the four types of movements are superimposed. Starting point (origin) is located on the sagittal midplane (Y = 0) of the subject, and the center of the screen (fitted arrows) is positioned 300 mm ahead of (x-axis) and 300 mm above (z-axis) the starting point. A target appears at a random location in a square area (40 mm × 40 mm), which is covered by the terminal points of the trajectories. Note the overlap of trajectories drawn with different colors. D, Top view of the hand trajectories in Epoch 2. Thirty traces of the fast movements are superimposed. Note that the center of the screen (filled arrow) is displaced to compensate for the visual displacement of the screen caused by the prisms. E, F, Tangential velocity profiles of the hand during the task movements shown inA–C. Profiles are aligned at the release of the button. Note the difference of scales in E and F.
Fig. 3.
Fig. 3.
Errors in two experiments (subject TY, base-left prisms) testing the transfer of adaptation from the fast to the slow reaching movements. A, Data under condition I from Figure1B. Open and filled circles in thetop panel show the horizontal errors relative to the target in the fast and the slow reaching task, respectively. Horizontal errors (ordinate) were measured in the direction of visual displacement in Epoch 2 and plotted against the trial sequence (abscissa). Vertical errors are shown in the middle panel with upward errors in the positive direction. Reaction times (filled squares) and movement durations (open squares) are plotted (ordinate, log scale) against trial sequence in the bottom panel. Vertical dotted linesshow the borders between Epoch 1-1, 1-2, 2, 3-1, and3-2. Required task movements (fast or slow) and the existence or absence of prisms (prism or no prism) are shown above.B, Data under condition IV from Figure 1B. Axes and symbols are the same as in A. Note the difference between the horizontal errors in Epoch 3 of B (arrows 2 and 4) and A (arrows 1and 3).
Fig. 4.
Fig. 4.
Velocity specificity of prism adaptation with fast reaching. A–D, Circles in the top panel show the median horizontal errors (n = 20) for 10 subjects under conditions I (A), II (B), III (C), and IV (D) from Figure 1B. Open, light-shaded, dark-shaded, and filled circles show errors from trials in the Fast, Semifast, Semislow, and Slowreaching tasks, respectively. The median horizontal errors for the four tasks in Epoch 1 (control) are indicated by circles at theright-hand side. Error bars indicate 25 and 75 percentiles. The median movement duration (open squares) and reaction time (filled squares) are shown in the bottom panel. The medians (symbols) lie between the 25 and 50 percentiles shown by solid lines. Note that most of the 25 and 75 percentiles of the movement duration (open squares) are hidden under the symbols. Data in Epochs 2 and 3 are shown inA, whereas only those in Epoch 3 are shown inB–D. Other notations are the same as in Figure 3. E, F, Distributions of the initial errors in Epoch 3-1 (E) and Epoch 3-2 (F) shown, respectively, for the required task movement in Epoch 3-1. Note that in F errors in the last trial of Epoch 3-1 are shown for the fast reaching task (5). Each box plot shows the 10, 25, 50, 75, and 90 percentiles of distribution. Numbers on the box plots correspond to arrows 1–8 in A–D. Note the decrease from 1 to 4 and the increase from 5 to 8. The medians were 48, 34, 30, and 26 mm for 1–4, and 6, 19, 23, and 34 mm for 5–8, respectively. Significant differences are indicated bybrackets with asterisks (*p < 0.05; **p < 0.01; ***p < 0.001; Wilcoxon signed rank test).
Fig. 5.
Fig. 5.
Velocity specificity of prism adaptation with slow reaching. A–D, Median horizontal errors (circles), movement durations (open squares), and reaction times (filled squares) under conditions VIII (A), VII (B), VI (C), and V (D) from Figure 1B. E, F, Distributions of the initial errors in Epoch 3-1 (E) and Epoch 3-2 (F) shown, respectively, for the required task movement in Epoch 3-1. Note that in F errors in the last trial of Epoch 3-1 are shown for the slow reaching task (5).Numbers correspond to arrows 1–8 inA–D. The medians were 37, 27, 25, and 9.5 mm for1–4 and 6.7, 4.5, 9.7, and 14 mm for 5–8, respectively. Other notations are the same as in Figure 4.
Fig. 6.
Fig. 6.
Lack of intermanual transfer of adaptation acquired with fast (A) and slow (B) reaching. Median horizontal errors (circles), movement durations (open squares), and reaction times (filled squares) are plotted against the trial sequence. Openand filled circles indicate the data from the ipsilateral (Ipsi) and the contralateral (Contra) arms, respectively. Mean errors in Epoch 1 (control) are shown to the right (circles) with error bars (25 and 75 percentiles). Only the data in Epochs 2 and 3 are shown. These figures show combined data from experiments in which the right (n = 16) and the left (n = 8) arms were used during the exposure to visual displacement. Note the larger initial errors in Epoch 3-2 (arrows 2, 4) than in Epoch 3-1 (arrows 1, 3). Other notations are the same as in Figure 4.
Fig. 7.
Fig. 7.
Three sites for prism adaptation in the transformations from visual input to motor output mediating target reaching. Optical images of the target on the retina are assumed to be mapped onto body-centered coordinates in the brain (arrow 1). This process is postulated to be used for the control of bilateral arm movements. The target location represented in the body-centered coordinates is translated into motor commands (arrow 3). Somatosensory signals from the arms and the efference copy of the motor commands are used for the estimation of hand position in the body-centered coordinates (arrow 2). Changes in the three transformations (arrows 1, 2, and3) correspond to the concepts of a Visual Shift, a Proprioceptive Shift, and Changes in Visuo-Motor Translation, respectively. See Discussion for details.

Similar articles

Cited by

References

    1. Ashe J, Georgopoulos AP. Movement parameters and neural activity in motor cortex and area 5. Cereb Cortex. 1994;6:590–600. - PubMed
    1. Baily JS. Adaptation to prisms: do proprioceptive changes mediate adapted behaviour with ballistic arm movements? Q J Exp Psychol. 1972;24:8–20. - PubMed
    1. Bizzi E, Mussa-Ivaldi FA, Giszter S. Computations underlying the execution of movement: a biological perspective. Science. 1991;253:287–291. - PubMed
    1. Cheney PD, Fetz EE. Functional classes of primate cortico-motoneuronal cells and their relation to active force. J Neurophysiol. 1980;44:773–791. - PubMed
    1. Flament D, Hore J. Relations of motor cortex neural discharge to kinematics of passive and active elbow movements in the monkey. J Neurophysiol. 1988;60:1268–1284. - PubMed