. 1997 Feb 7;275(5301):844-7.
doi: 10.1126/science.275.5301.844.

Calcium waves in retinal glial cells

Affiliations

Calcium waves in retinal glial cells

E A Newman et al. Science. .

Abstract

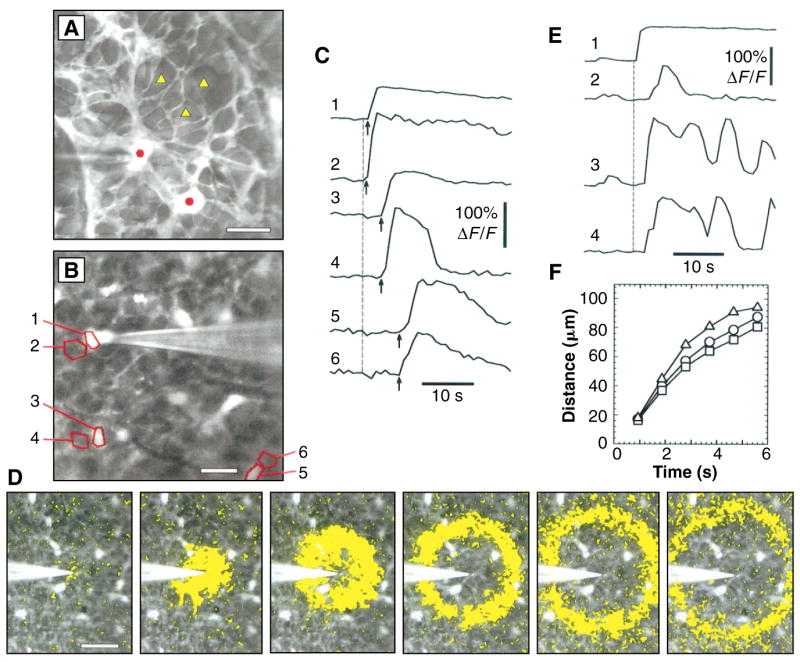
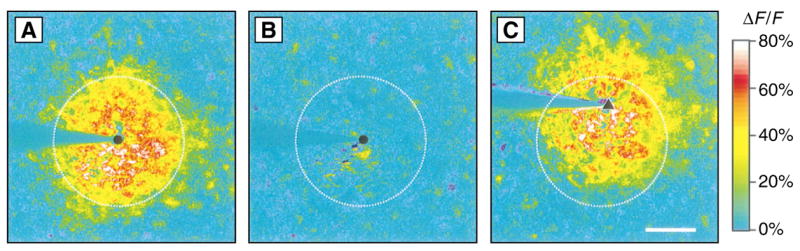
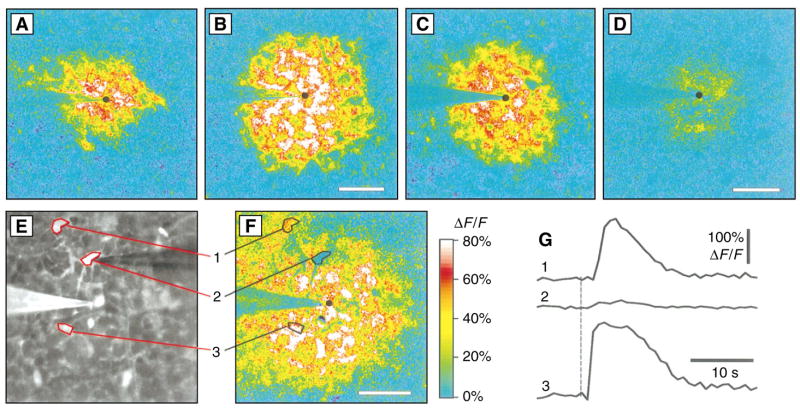
Calcium signals were recorded from glial cells in acutely isolated rat retina to determine whether Ca2+ waves occur in glial cells of intact central nervous system tissue. Chemical (adenosine triphosphate), electrical, and mechanical stimulation of astrocytes initiated increases in the intracellular concentration of Ca2+ that propagated at approximately 23 micrometers per second through astrocytes and Müller cells as intercellular waves. The Ca2+ waves persisted in the absence of extracellular Ca2+ but were largely abolished by thapsigargin and intracellular heparin, indicating that Ca2+ was released from intracellular stores. The waves did not evoke changes in cell membrane potential but traveled synchronously in astrocytes and Müller cells, suggesting a functional linkage between these two types of glial cells. Such glial Ca2+ waves may constitute an extraneuronal signaling pathway in the central nervous system.


Figures

Fig. 1
Fig. 1
Propagation of Ca2+ waves in glial cells. (A) Astrocytes (circles) and end feet of Müller cells (triangles) in a confocal fluorescence image of the vitreal surface of the rat retina labeled with Calcium Green-1. (B) The retinal surface with six measurement regions outlined. The stimulating pipette is touching region 1. Regions 1, 3, and 5 outline astrocytes; regions 2, 4, and 6 outline adjacent Müller cell endfeet. (C) Change in fluorescence, normalized to baseline fluorescence (ΔF/F ), for the six regions in (B). Onset of the mechanical stimulus is indicated by vertical dashed line; arrival of the Ca2+ wave is marked by arrows. (D) Spread of a Ca2+ wave initiated by a mechanical stimulus. The fluorescence image is shown in black and white. Superimposed yellow rings mark the leading edge of the Ca2+ wave (where the change in fluorescence between successive panels exceeded a threshold value). Interval between panels, 0.93 s. (E) Increases of Ca2+ within one astrocyte (trace 1) and three Müller cells (traces 2 through 4), initiated by a mechanical stimulus. (F) Propagation velocity of Ca2+ waves initiated by mechanical (circles), electrical (squares), and chemical (ATP, triangles) stimuli. Mean distance to the outer edge of the Ca2+ wave rings is plotted. Scale bars: (A), 20 μm; (B), 25 μm; and (D), 50 μm.
Fig. 2
Fig. 2
Normalized fluorescence-difference images of Ca2+ waves evoked by repeated stimulation. The pseudocolor images represent a comparison of the mean fluorescence of 15 consecutive images after stimulation and the mean fluorescence of 20 images before stimulation. (A) Ca2+ wave evoked by a mechanical stimulus. (B) Stimulation at the same site (circle) 180 s later elicited no response. (C) Ca2+ wave evoked by stimulation at a second site (triangle) after an additional 90 s. Dashed circles indicate the response region in (A). Scale bar, 50 μm.
Fig. 3
Fig. 3
Generation of Ca2+ waves by the release of Ca2+ from internal stores. (A) Ca2+ wave evoked by an electrical stimulus. (B) Different region of the retina shown in (A), stimulated after 31 min in 0 mM Ca2+ and 0.5 mM EGTA. (C) Ca2+ wave evoked by an electrical stimulus under control conditions. (D) Different region of the retina shown in (C), stimulated 16 min after the addition of 1.5 μM thapsigargin. (E) Fluorescence image showing retina, stimulating pipette [left, made visible by coating with DiI (1,1′-diocta-decyl-3,3,3′,3′-tetramethylindocarbo-cyanine perchlorate)], and patch pipette (right, used to introduce heparin and Calcium Green-1 into the cell). A heparin-containing astrocyte (cell 2) and two untreated astrocytes (cells 1 and 3) are outlined. (F) Ca2+ wave evoked by ejection of ATP in same retinal area as shown in (E). (G) Change in fluorescence of regions shown in (E) and (F ). Large [Ca2+]i increases occurred in untreated cells but not in the heparin-filled cell. Panels (A) through (D) and (F ) are normalized fluorescence-difference images. Black circles indicate stimulation sites. Scale bars for all panels, 50 μm.

References

    1. Kettenmann H, Ransom BR. Neuroglia. Oxford Univ. Press; Oxford: 1995.
    1. Finkbeiner SM. Glia. 1993;9:83. - PubMed
    1. Finkbeiner SM. Neuron. 1992;8:1101. - PubMed
    2. Charles AC, et al. J Cell Biol. 1992;118:195. - PMC - PubMed
    1. Enkvist MOK, McCarthy KD. J Neurochem. 1992;59:519. - PubMed
    1. Cornell-Bell AH, Finkbeiner SM, Cooper MS, Smith SJ. Science. 1990;247:470. - PubMed

Publication types

MeSH terms