. 1997 Jan 21;94(2):537-42.
doi: 10.1073/pnas.94.2.537.

Mitosis-promoting factor-mediated suppression of a cloned delayed rectifier potassium channel expressed in Xenopus oocytes

Affiliations

Mitosis-promoting factor-mediated suppression of a cloned delayed rectifier potassium channel expressed in Xenopus oocytes

A Brüggemann et al. Proc Natl Acad Sci U S A. .

Abstract

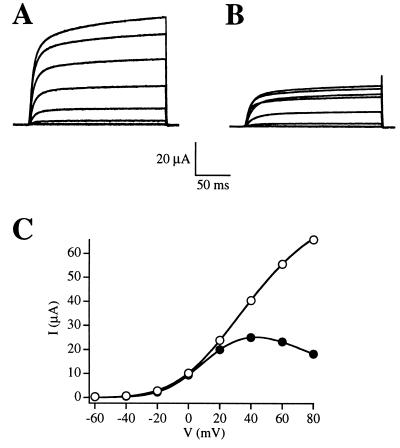
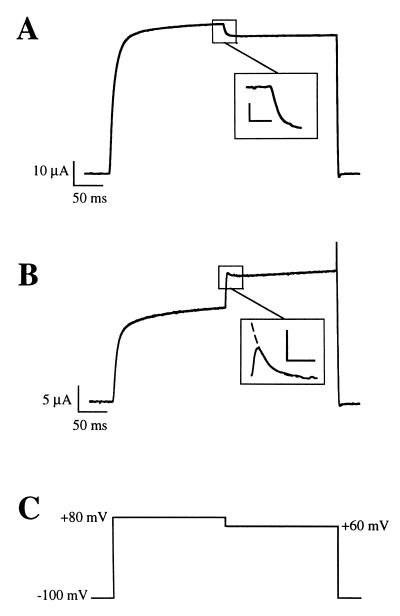
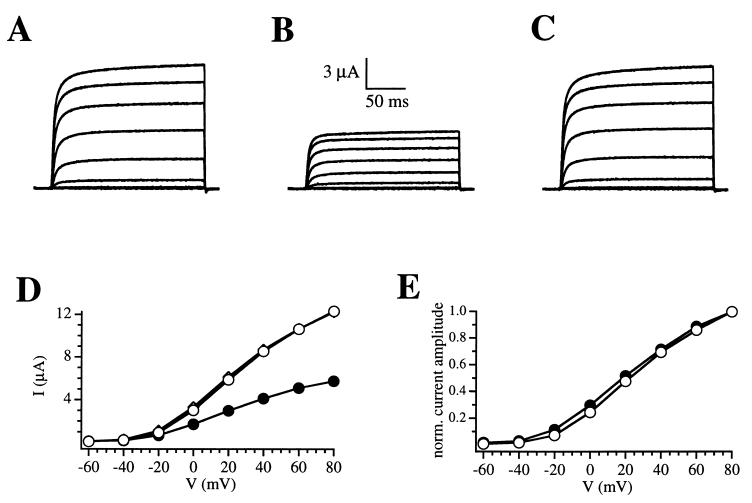
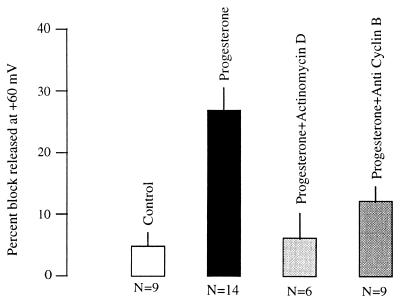
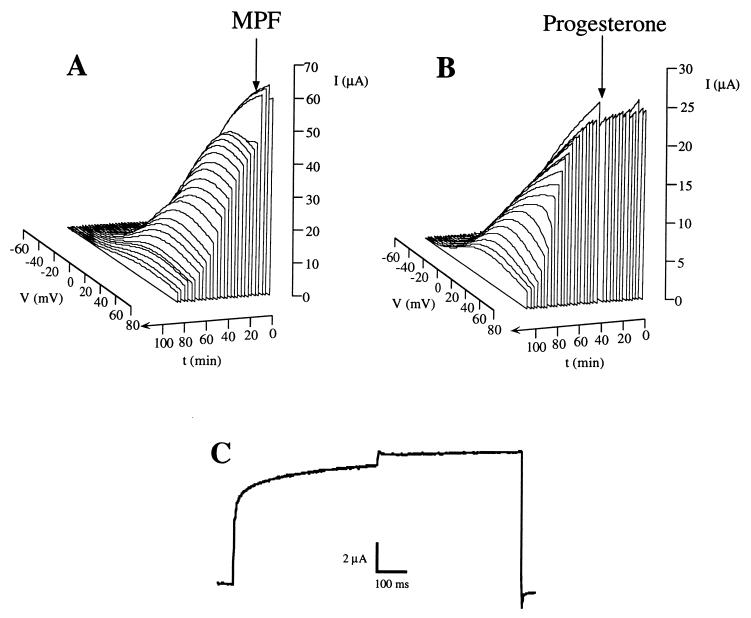
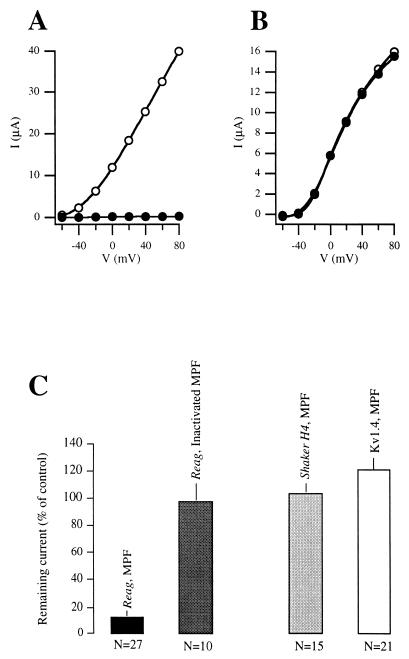
The cell cycle is the crucial process that leads to mitosis in all cell types. The dramatic redirectioning of many cellular processes during the cycle is known to involve ion channels, either changing their level of expression or their voltage dependence, as in the case of inward rectifiers. Here we describe the specific inhibition of heterologously expressed ionic channels at the onset of maturation in Xenopus oocytes. In cells expressing rat eag (R-eag) potassium channels, maturation induces a dramatic reduction in the current amplitude, which is almost complete in most cases. The key molecule in oocyte maturation, the mitosis-promoting factor (a complex of cyclin B and p34cdc2), is able to induce similar changes when injected into the oocytes.


Figures

Figure 1
Figure 1
Comparison of the shape and amplitude of raw current traces (A, B) and the I–V relationships (C) of R-eag before (A, open circles) and after (B, solid circles) the treatment with progesterone. Currents were elicited by depolarizing steps in Xenopus oocytes expressing R-eag mRNA, before (A) or during (B) treatment with 5 μg/ml progesterone. The depolarizations ranged from −60 to +80 mV in increments of 20 mV from a holding potential of −100 mV.
Figure 2
Figure 2
Representative traces of the effect of a voltage step from +80 to +60 mV before (A) and 1 h after the application of 5 μg/ml progesterone (B). For these experiments, oocytes were held at −100 mV and the current was elicited by a depolarization to +80 mV. After 200 ms, the voltage was stepped to +60 mV, as depicted by the voltage template in C. The Inset of B shows the extrapolation to time 0 of the −20 mV step. The scale bars in the insets represent 2 μA and 10 ms (A) and 500 nA and 10 ms (B).
Figure 3
Figure 3
Effect of caffeine-induced calcium release on R-eag current amplitude. (A) Control traces. During the application of 10 mM caffeine (B), the current is reduced at all voltages. After washout (C), the amplitude readily recovers and remains stable for the rest of the experiment. (D) I–V relationships corresponding to control traces (open circles), 10 mM caffeine (solid circles), and washout of the drug (diamonds). The data correspond to A, B, and C, respectively. The washout I–V plot is virtually overlapping the control oneplot. (E) I–V plots from D (records A and B) have been scaled to show that the current amplitude is homogeneously reduced throughout the voltage axis by the action of caffeine (symbols are as in D).
Figure 4
Figure 4
Effect of progesterone (5 μg/ml) on the development of voltage-dependent inhibition of R-eag currents, and inhibition of the effect of the hormone in oocytes preincubated with 10 μg/ml actinomycin D or injected with 10 ng anti human cyclin B1 antibodies 30 min before progesterone application.
Figure 5
Figure 5
Representation of the time course of the currents after the injection of MPF (A) and the application of progesterone (20 μg/ml) (B). The arrows indicate the time of injection or application. Note that for clarity, the time axis has been depicted such that it increaseds toward the front of the figure. (C) Initial effect produced by MPF injection, in an experiment identical to those depicted in Fig. 2 for progesterone treatment.
Figure 6
Figure 6
Current-voltage relationships in oocytes expressing R-eag (A) or Shaker H4 (B) channels, before (open circles) and after the injection of MPF (closed circles). In B, both curves are overlapping. (C) Reduction of current amplitude induced by the injection of MPF, or heat-inactivated MPF, into Xenopus oocytes expressing R-eag, or MPF into oocytes expressing either Shaker H4 or Kv1.4 channels.

References

    1. Hausen P, Riebesell M. The Early Development of Xenopus laevis. Berlin: Springer; 1990. pp. 15–18.
    1. Maller J L. Biochemistry. 1990;29:3157–3166. - PubMed
    1. Lee M, Nurse P. Nature (London) 1987;327:31–35. - PubMed
    1. King R W, Jackson P K, Kirschner M W. Cell. 1994;79:563–571. - PubMed
    1. Nurse P. Cell. 1994;79:547–550. - PubMed

Publication types

LinkOut - more resources