. 1997 Jan 21;94(2):713-8.
doi: 10.1073/pnas.94.2.713.

Molecular characterization of two mammalian bHLH-PAS domain proteins selectively expressed in the central nervous system

Affiliations

Molecular characterization of two mammalian bHLH-PAS domain proteins selectively expressed in the central nervous system

Y D Zhou et al. Proc Natl Acad Sci U S A. .

Abstract

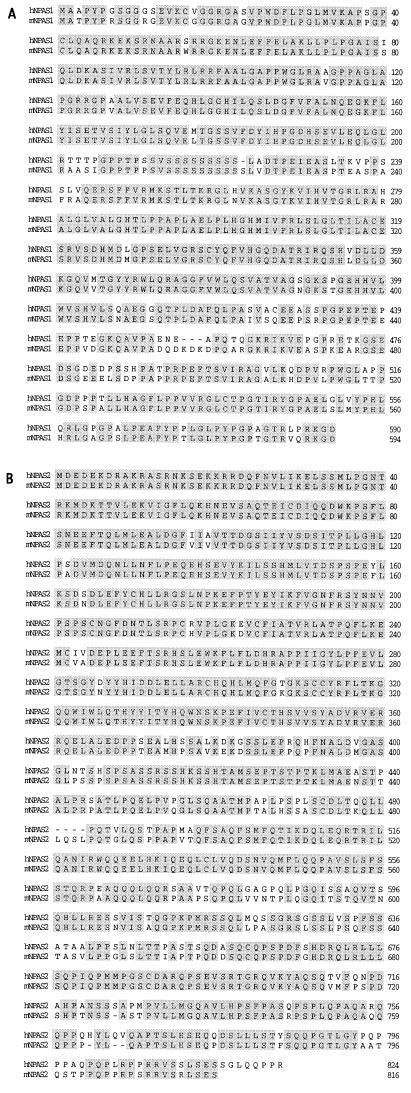
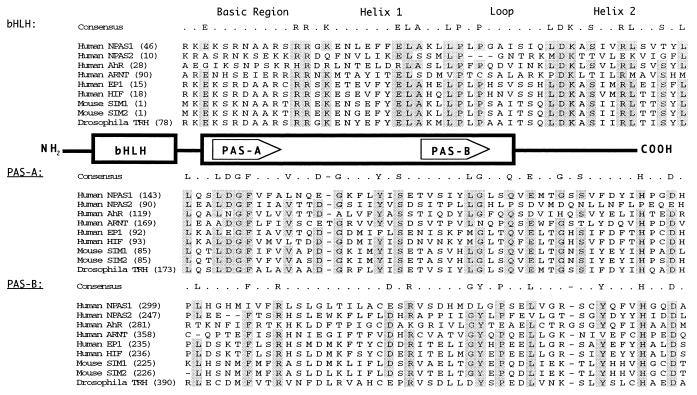
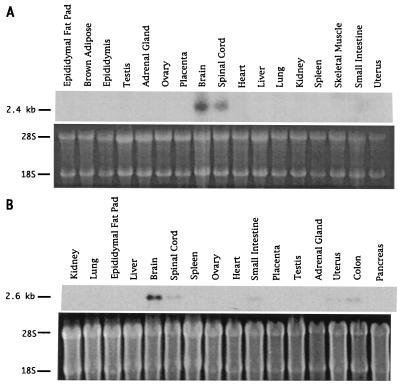
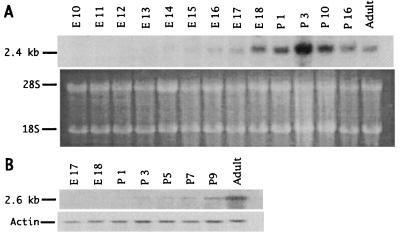
Here we describe two mammalian transcription factors selectively expressed in the central nervous system. Both proteins, neuronal PAS domain protein (NPAS) 1 and NPAS2, are members of the basic helix-loop-helix-PAS family of transcription factors. cDNAs encoding mouse and human forms of NPAS1 and NPAS2 have been isolated and sequenced. RNA blotting assays demonstrated the selective presence of NPAS1 and NPAS2 mRNAs in brain and spinal cord tissues of adult mice. NPAS1 mRNA was first detected at embryonic day 15 of mouse development, shortly after early organogenesis of the brain. NPAS2 mRNA was first detected during early postnatal development of the mouse brain. In situ hybridization assays using brain tissue of postnatal mice revealed an exclusively neuronal pattern of expression for NPAS1 and NPAS2 mRNAs. The human NPAS1 gene was mapped to chromosome 19q13.2-q13.3, and the mouse Npas1 gene to chromosome 7 at 2 centimorgans. Similarly, the human NPAS2 gene was assigned to chromosome 2p11.2-2q13, and the mouse Npas2 gene to chromosome 1 at 21-22 centimorgans. The chromosomal regions to which human NPAS1 and NPAS2 map are syntenic with those containing the mouse Npas1 and Npas2 genes, indicating that the mouse and human genes are true homologs.


Figures

Figure 1
Figure 1
Primary amino acid sequences of NPAS1 (A) and NPAS2 (B). Each protein sequence was conceptually translated from the sequences of mouse and human cDNA clones. Amino acid identities between mouse and human proteins are indicated by shading. GenBank accession nos. are: mouse NPAS1 (U77967), human NPAS1 (U77968), mouse NPAS2 (U77969), and human NPAS2 (U77970).
Figure 2
Figure 2
Sequence comparison of nine bHLH-PAS domain proteins. The schematic diagram (Middle) shows the canonical organization of bHLH-PAS domain proteins. Amino acid sequences shown above correspond to the bHLH domains, sequences shown below correspond to the PAS-A and PAS-B domains. Individual amino acid sequences were obtained using the Entrez sequence retrieval system (National Center for Biotechnology Information). Shaded amino acids, designated consensus, represent residues identical among seven or more of the nine proteins analyzed. Numbers in parentheses after designation of each protein (Left) represent the residue number at which each sequence starts relative to the initiator methionine of the relevant protein.
Figure 3
Figure 3
Tissue distributions of NPAS1 (A) and NPAS2 (B) mRNA in adult mice. (A and B Top) Northern blot images developed using hybridization probes specific to NPAS1 and NPAS2 mRNA. (A and B Bottom) Ethidium bromide staining patterns of RNA samples used for Northern blotting.
Figure 4
Figure 4
Temporal patterns of appearance of NPAS1 (A) and NPAS2 (B) mRNA in developing mice. (A Top) Northern blot image developed using a hybridization probe specific to NPAS1 mRNA. (A Bottom) Ethidium bromide staining pattern of RNA samples used for Northern blotting. (B Top) Northern blot image developed using a hybridization probe specific to NPAS2 mRNA. (B Bottom) Image developed using a probe specific for a β-actin mRNA.
Figure 5
Figure 5
In situ localization of NPAS1 (A, B, E, F, and J) and NPAS2 (C, D, G, H, and K) transcripts in coronal (A–D) and sagittal (E and L) sections of brain from an 11-day-old postnatal mouse. Images are shown of in situ hybridization patterns developed using antisense probes (B, C, F, G, J, and K) and control, sense probes (A, D, E, and H). Nissl-stained sections (I and L) correspond to the fields shown in J and K. CA3, CA3 region of the hippocampus; CPu, caudate putamen; CxP, cortical plate; DG, dentate gyrus; HT, hypothalamus; ML, molecular layer; NC, neocortex; OB, outer blade of the dentate gyrus; PoDG, polymorph layer of the dentate gyrus; SC, superior colliculus; T, thalamus. (Bars: A–H = 500 μm, I–L = 250 μm.)

References

    1. Jackson F R, Bargiello T A, Yun S-H, Young M W. Nature (London) 1986;320:185–188. - PubMed
    1. Citri Y, Colot H V, Jacquier A C, Yu Q, Hall J C, Baltimore D, Rosbash M. Nature (London) 1987;326:42–47. - PubMed
    1. Huang Z J, Edery I, Rosbash M. Nature (London) 1993;364:259–262. - PubMed
    1. Hoffman E C, Reyes H, Chu F-F, Sander F, Conley L H, Brooks B A, Hankinson O. Science. 1991;252:954–958. - PubMed
    1. Nambu J R, Lewis J O, Wharton K A, Jr, Crews S T. Cell. 1991;67:1157–1167. - PubMed

Publication types