. 1997 Jan 27;136(2):355-66.
doi: 10.1083/jcb.136.2.355.

Dynamic properties of an inositol 1,4,5-trisphosphate- and thapsigargin-insensitive calcium pool in mammalian cell lines

Affiliations

Dynamic properties of an inositol 1,4,5-trisphosphate- and thapsigargin-insensitive calcium pool in mammalian cell lines

P Pizzo et al. J Cell Biol. .

Abstract

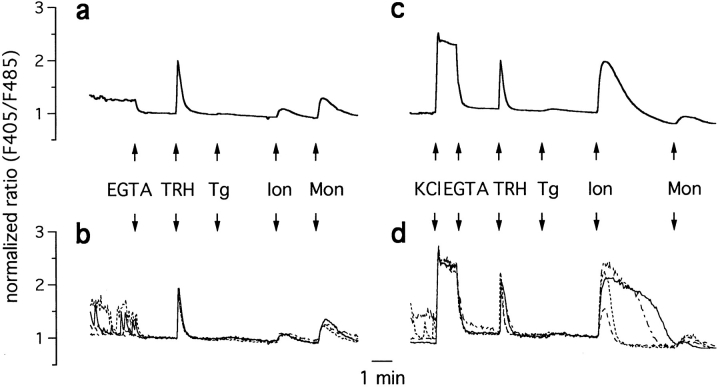
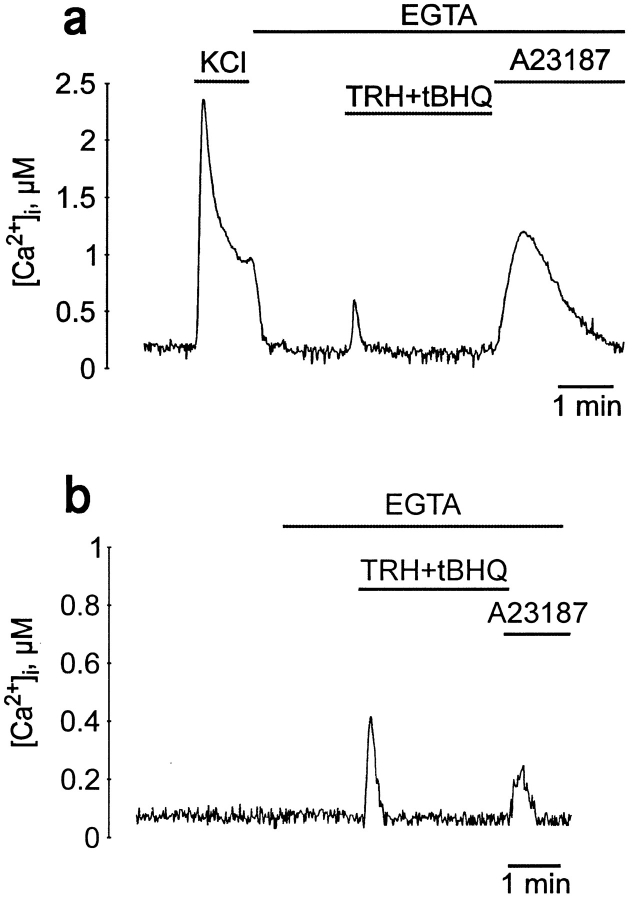
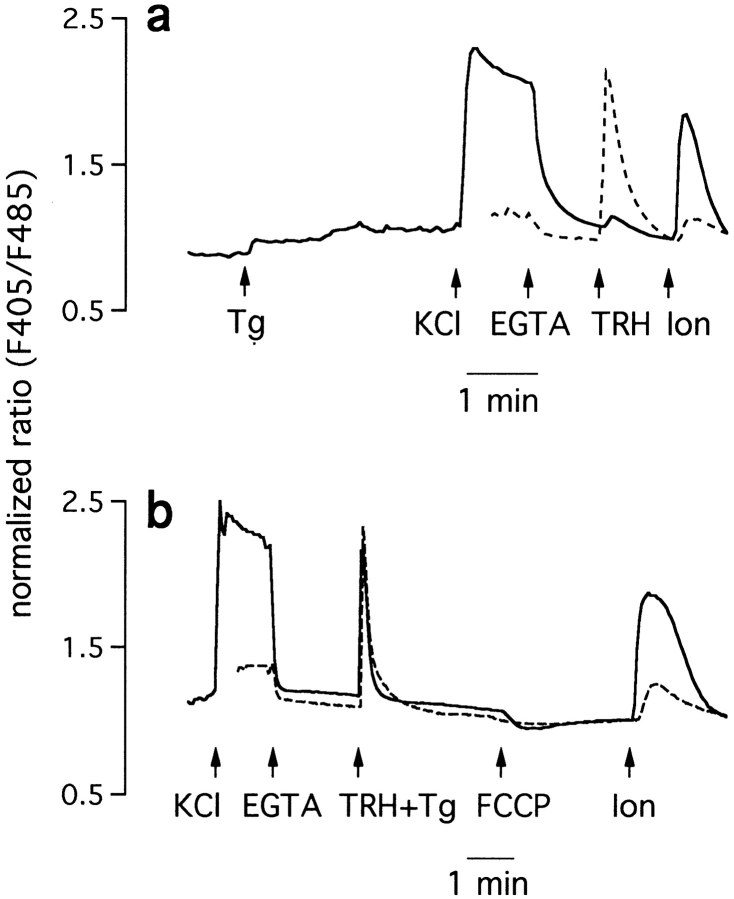
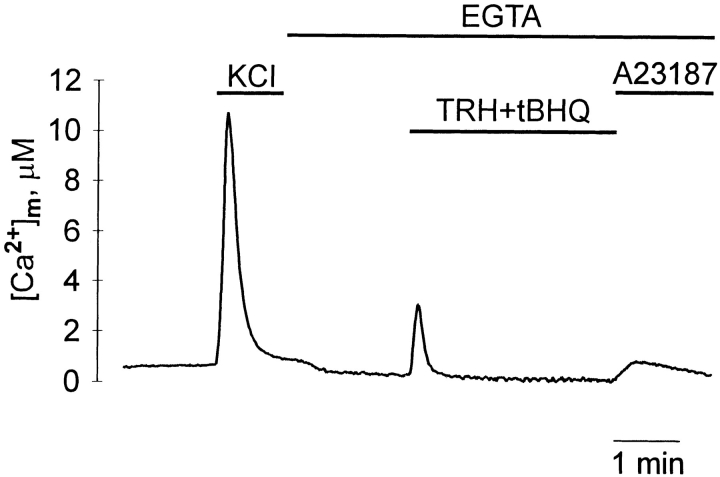
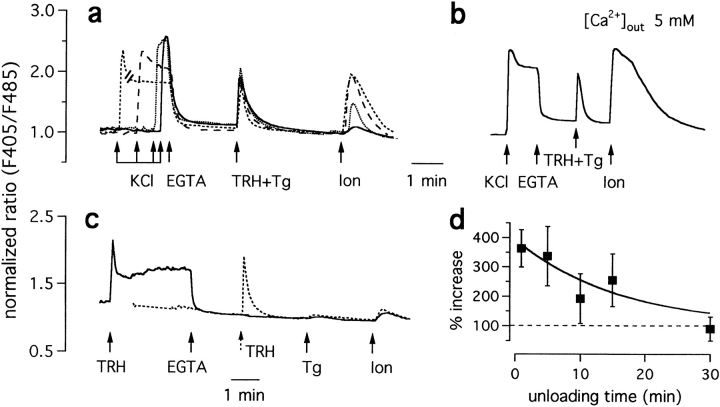
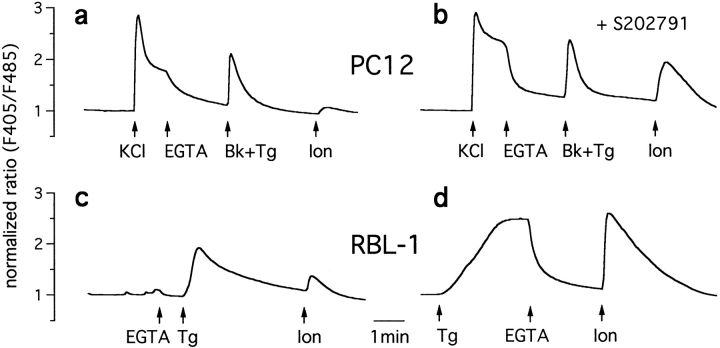
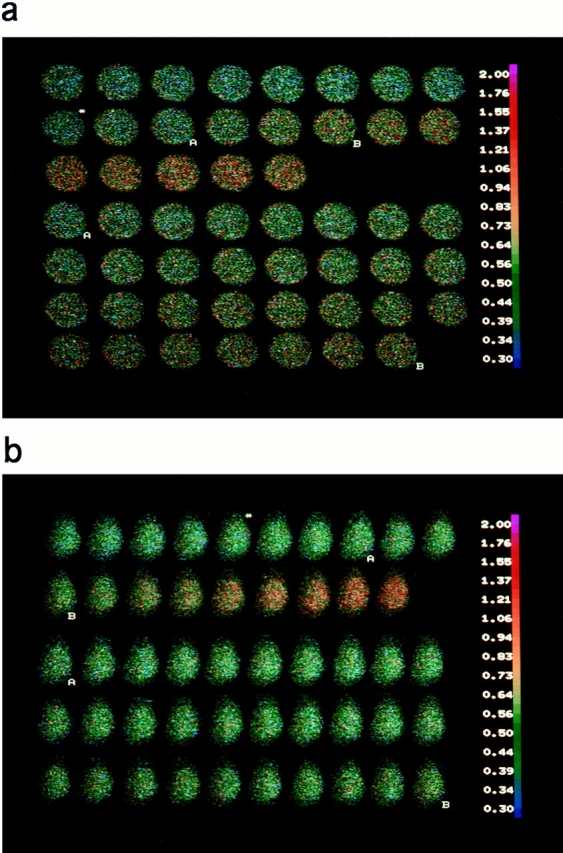
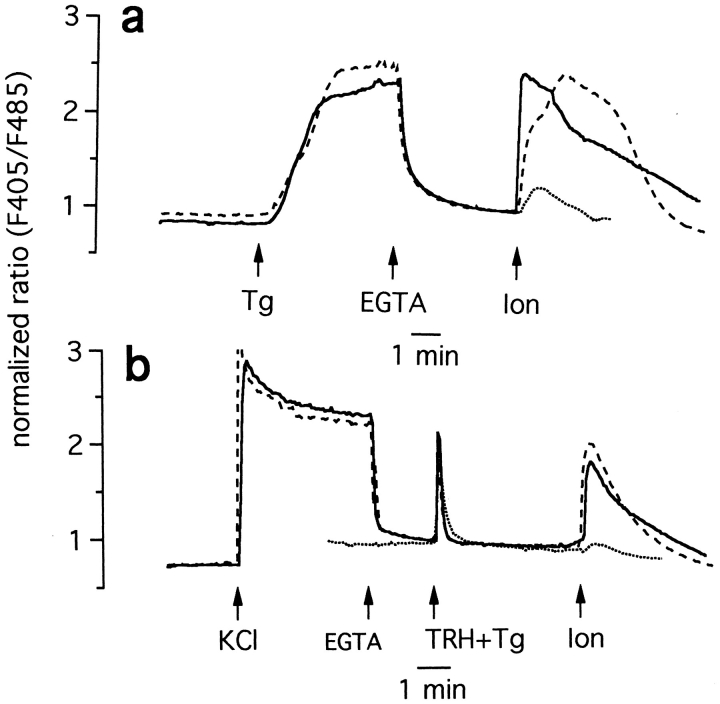
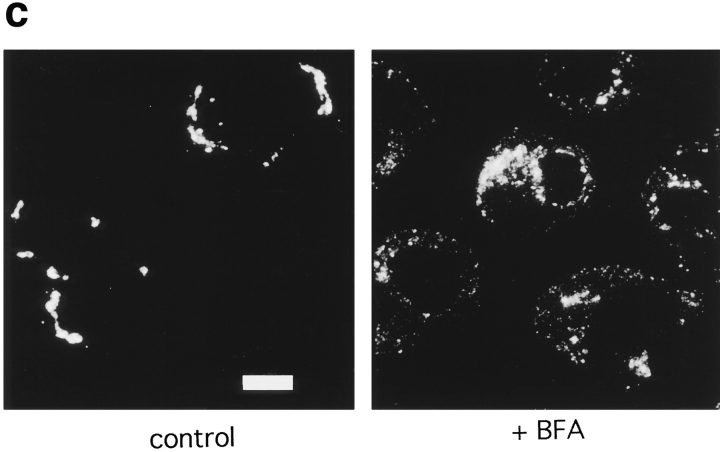
The functional characteristics of a nonacidic, inositol 1,4,5-trisphosphate- and thapsigargin-insensitive Ca2+ pool have been characterized in mammalian cells derived from the rat pituitary gland (GH3, GC, and GH3B6), the adrenal tissue (PC12), and mast cells (RBL-1). This Ca2+ pool is released into the cytoplasm by the Ca2+ ionophores ionomycin or A23187 after the discharge of the inositol 1,4,5-trisphosphate-sensitive store with an agonist coupled to phospholipase C activation and/or thapsigargin. The amount of Ca2+ trapped within this pool increased significantly after a prolonged elevation of intracellular Ca2+ concentration elicited by activation of Ca2+ influx. This pool was affected neither by caffeine-ryanodine nor by mitochondrial uncouplers. Probing mitochondrial Ca2+ with recombinant aequorin confirmed that this pool did not coincide with mitochondria, whereas its homogeneous distribution across the cytosol, as revealed by confocal microscopy, and its insensitivity to brefeldin A make localization within the Golgi complex unlikely. A proton gradient as the driving mechanism for Ca2+ uptake was excluded since ionomycin is inefficient in releasing Ca2+ from acidic pools and Ca2+ accumulation/release in/from this store was unaffected by monensin or NH4Cl, drugs known to collapse organelle acidic pH gradients. Ca2+ sequestration inside this pool, thus, may occur through a low-affinity, high-capacity Ca2+-ATPase system, which is, however, distinct from classical endosarcoplasmic reticulum Ca2+-ATPases. The cytological nature and functional role of this Ca2+ storage compartment are discussed.


Figures

Figure 1
Figure 1
Dynamic properties of Ca2+ pools in GH3 cells. Experiments were carried out on monolayers of GH3 cells, loaded with indo-1, as described in Materials and Methods. The traces in a and c are an average of 30 cells, while in b and d, four typical single cell traces of the same experiment are presented. In this and the following figures, representative of at least three experiments carried out in different cell batches, the normalized ratio of the intensity of the light emitted at the two wavelengths (F405/F485), a function of [Ca2+]i, is displayed on the left-hand side. Where indicated, KCl (30 mM), EGTA (4 mM), TRH (1 μM), Tg, (1 μM), ionomycin (Ion; 1 μM) and monensin (Mon; 1 μM) were added.
Figure 2
Figure 2
Ca2+ pools in GH3 cells revealed by cytAEQ transfection. Reconstitution with coelenterazine, as well as detection and calibration of the luminescence signal into [Ca2+]i values, were performed as described in Materials and Methods. These experiments were carried out in mKRB at 37°C, under perfusion; similar results were obtained at room temperature. tBHQ and A23187 were preferred to Tg as a SERCA blocker and to ionomycin as a Ca2+ ionophore because the latter compounds tend to adhere to the plastic tubes of the perfusion system. For the same reason, TRH was used at 10 times higher concentration compared to confocal experiments. Indeed, in confocal experiments, tBHQ, A23187, and TRH at high doses induced [Ca2+]i rises comparable to those measured using Tg (1 μM), ionomycin (1 μM), or TRH (1 μM). Where indicated, the cells were stimulated with KCl (30 mM), EGTA (4 mM), TRH (10 μM), tBHQ, (50 μM), and A23187 (20 μM).
Figure 3
Figure 3
Tg and FCCP insensitivity of the SIC pool. Effect of Tg (a) and FCCP (b). Conditions as in Fig. 1; in both panels, the dashed trace represents control cells. Where indicated, KCl (30 mM), EGTA (4 mM), TRH (1 μM), Tg (10 μM in a, 1 μM in b), ionomycin (Ion; 1 μM), and FCCP (10 μM) were added.
Figure 4
Figure 4
[Ca2+]m values in GH3 cells after mtAEQ transfection. GH3 cells were transfected with mtAEQ (Materials and Methods). After reconstitution with coelenterazine, the experiments were carried out as described in Fig. 2. Where indicated, the cells were stimulated with KCl (30 mM), EGTA (4 mM), TRH (10 μM), tBHQ (50 μM), and A23187 (20 μM).
Figure 5
Figure 5
Kinetic properties of the SIC pool. (a) Time course of Ca2+ uptake into the SIC pool (continuous trace, 10 s; dotted trace, 20 s; long-dashed trace, 60 s; shortdashed trace, 5 min). (b) Dependence of the SIC pool on external Ca2+ concentration. Conditions as in Fig. 1, but with 5 mM external Ca2+. (c) A prolonged [Ca2+]i rise was achieved by stimulating cells with TRH (1 μM) in mKRB (continuous trace). Control cells were stimulated with TRH in EGTA-containing mKRB (dashed trace). (d) Unloading kinetics of the Ca2+ pool released by ionomycin. Cells were depolarized with 30 mM KCl for 60 s, washed with fresh medium, and incubated for the indicated time in mKRB medium. Data are presented as percentage increase in the area of the SIC pool with respect to the value measured in control unstimulated cells (100%) (mean ± SEM of three experiments). In a–c, where indicated, KCl (30 mM), TRH (1 μM), EGTA (4 mM), Tg (1 μM), and ionomycin (Ion; 1 μM) were added.
Figure 6
Figure 6
Detection of the SIC pool in other cell lines. Cells from the neuroendocrine cell line PC12 were stimulated with a protocol similar to that described in Fig. 1 c, in the absence (a) or in the presence (b) of the agonist of L-VOCCs, S202791. c and d show the behavior of the rat basophilic leukemia cell line RBL-1. Where indicated, KCl (60 mM), EGTA (4 mM), bradykinin (Bk; 1 μM), Tg (1 μM), ionomycin (Ion; 1 μM), and the L-VOCCs agonist S202791 (1 μM) were added.
Figure 7
Figure 7
High-resolution confocal imaging of [Ca2+]i rises induced by ionomycin. GH3 (a) and RBL-1 cells (b) were treated as described in Figs. 1 c and 6 c, respectively, to induce the SIC pool. Before ionomycin addition (*), the acquisition was changed from 2 s/ratio frame (16 images/frame) to 67 ms/ratio frame (1 image/frame). The first group of pictures (on the top of each panel) presents pseudocolor ratio images with a frame interval of 670 ms. The second group of pictures (on the bottom of each panel) represents images of the same cell (from A to B) with a frame interval of 67 ms. The ratio of the intensity of the light emitted at the two wavelengths (F405/F485), a function of [Ca2+]i , is displayed as a pseudocolor scale on the right side of each panel.
Figure 8
Figure 8
Effect of BFA on the SIC pool. RBL-1 (a) and GH3 cells (b) were pretreated with BFA (10 μg/ml) at 37°C during the last 15 min of the loading period with indo-1/AM. Experiments were carried out as described in Figs. 1 c and 6 c for GH3 and RBL-1 cells, respectively, in the absence (dashed traces) or in the continuous presence of BFA (10 μg/ml; continuous traces). The dotted traces represent unstimulated control cells not treated with BFA. For clarity, in a, only the ionomycin addition to control cells (dotted trace) is shown. Where indicated, KCl (30 mM), TRH (1 μM), EGTA (4 mM), Tg (1 μM), and ionomycin (Ion; 1 μM) were added. Immunolocalization of the trans-Golgi network protein TGN38 (c; see Materials and Methods for details) in GH3 cells, with or without BFA. Bar, 4.5 μm.
Figure 8
Figure 8
Effect of BFA on the SIC pool. RBL-1 (a) and GH3 cells (b) were pretreated with BFA (10 μg/ml) at 37°C during the last 15 min of the loading period with indo-1/AM. Experiments were carried out as described in Figs. 1 c and 6 c for GH3 and RBL-1 cells, respectively, in the absence (dashed traces) or in the continuous presence of BFA (10 μg/ml; continuous traces). The dotted traces represent unstimulated control cells not treated with BFA. For clarity, in a, only the ionomycin addition to control cells (dotted trace) is shown. Where indicated, KCl (30 mM), TRH (1 μM), EGTA (4 mM), Tg (1 μM), and ionomycin (Ion; 1 μM) were added. Immunolocalization of the trans-Golgi network protein TGN38 (c; see Materials and Methods for details) in GH3 cells, with or without BFA. Bar, 4.5 μm.

Similar articles

Cited by

References

    1. Amundson J, Clapham D. Calcium waves. Curr Opin Neurobiol. 1993;3:375–382. - PubMed
    1. Barry VA, Cheek TR. A caffeine- and ryanodine-sensitive intracellular Ca2+ store can act as a Ca2+ source and a Ca2+sink in PC12 cells. Biochem J. 1994;300:589–597. - PMC - PubMed
    1. Bastianutto C, Clementi E, Codazzi F, Podini P, De Giorgi F, Rizzuto R, Meldolesi J, Pozzan T. Overexpression of calreticulin increases the Ca2+ capacity of rapidly exchanging Ca2+stores and reveals aspects of their lumenal microenvironment and function. J Cell Biol. 1995;130:847–855. - PMC - PubMed
    1. Bian J, Ghosh TK, Wang JC, Gill DL. Identification of intracellular calcium pools. Selective modification by thapsigargin. J Biol Chem. 1991;266:8801–8806. - PubMed
    1. Bobe R, Bredoux R, Wuytack F, Quarck R, Kovacs T, Papp B, Corvazier E, Magnier C, Enouf J. The rat platelet 97-kDa Ca2+ATPase isoform is the sarcoendoplasmic reticulum Ca2+ATPase 3 protein. J Biol Chem. 1994;269:1417–1424. - PubMed

Publication types

MeSH terms

Grants and funding