. 1997 Feb 4;94(3):814-9.
doi: 10.1073/pnas.94.3.814.

Stochastic mechanisms in gene expression

Stochastic mechanisms in gene expression

H H McAdams et al. Proc Natl Acad Sci U S A. .

Abstract

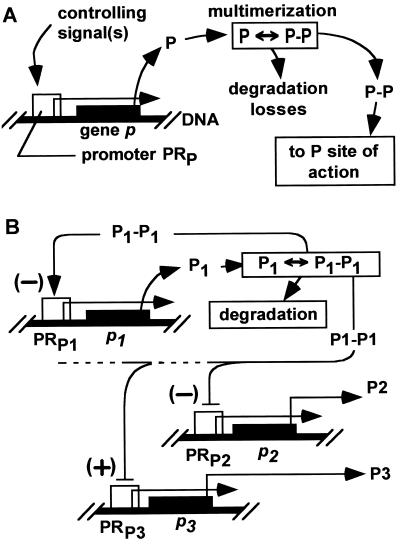
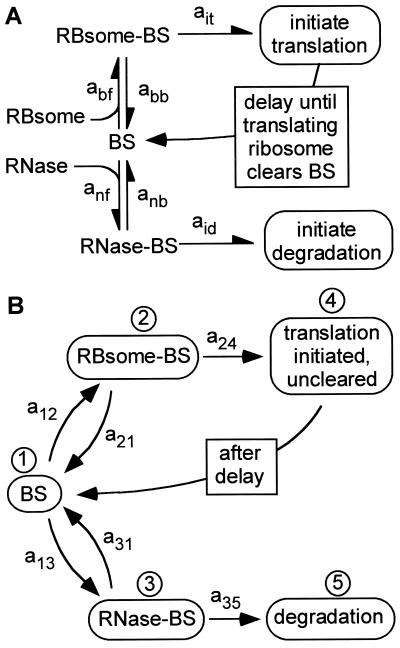
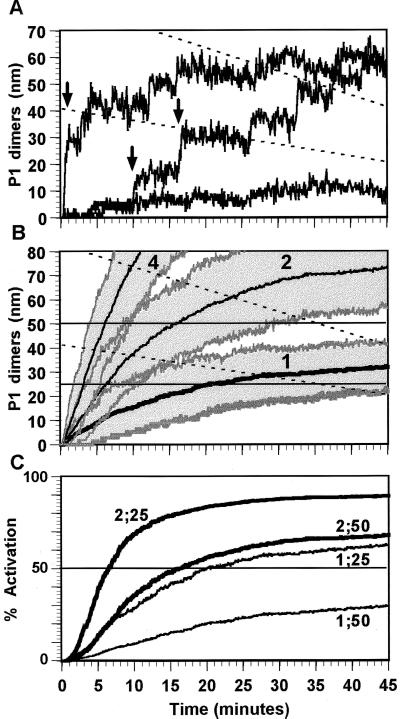
In cellular regulatory networks, genetic activity is controlled by molecular signals that determine when and how often a given gene is transcribed. In genetically controlled pathways, the protein product encoded by one gene often regulates expression of other genes. The time delay, after activation of the first promoter, to reach an effective level to control the next promoter depends on the rate of protein accumulation. We have analyzed the chemical reactions controlling transcript initiation and translation termination in a single such "genetically coupled" link as a precursor to modeling networks constructed from many such links. Simulation of the processes of gene expression shows that proteins are produced from an activated promoter in short bursts of variable numbers of proteins that occur at random time intervals. As a result, there can be large differences in the time between successive events in regulatory cascades across a cell population. In addition, the random pattern of expression of competitive effectors can produce probabilistic outcomes in switching mechanisms that select between alternative regulatory paths. The result can be a partitioning of the cell population into different phenotypes as the cells follow different paths. There are numerous unexplained examples of phenotypic variations in isogenic populations of both prokaryotic and eukaryotic cells that may be the result of these stochastic gene expression mechanisms.


Figures

Figure 1
Figure 1
(A) A common coupled-reaction architecture for transmission of information or control in one link in a genetically coupled regulatory cascade. The promoter controls the transcript initiation rate. Each transcript leads to a pulse of protein production from downstream genes. Signal concentration at any time is determined by the cumulation over time of protein production and losses. The concentration of the effective form of a signal protein is sensed and responded to at its site(s) of action. The active form of protein signals is commonly a multimer; we assume a dimer here. Duplicate operator sites binding the same protein are also a common motif [true of 43% of 76 repressible promoters known in 1991 (1)]. P, Pi, proteins; PRx, promoter for protein x. (B) A representative autoregulating prokaryotic genetic circuit where the protein product controls its promoter. Autoregulation often serves to stabilize protein concentrations in a range that establishes sustained activation (or repression) of several controlled promoters.
Figure 2
Figure 2
Reaction model (A) and binding state model (B) characterizing sequential competitions between ribosomes and RNase E at two closely located sites on the transcript (denoted BS for binding sites). Binding of either occludes the binding site of the other. After ribosome binding leading to initiation of translation, the competition recurs after a delay while the translating ribosome’s footprint clears the two sites. This process repeats until RNase E binds and initiates degradation of the transcript. Each competition is an independent event with a probabilistic outcome. A transcript is initially in state 1 and thereafter in one of the five states shown in B. The number of proteins produced, N, will be the number of times state 4 is traversed before the process terminates in state 5. When the system is in any state i, aij dt is the probability of transition to state j in time interval {t, t + dt}, where i and j each denotes one of the states {1, … , 5}. Observations (see text) suggest that a24, a12a21 and a35, a13a31. When the system is in state 1, the probability of another protein is approximately (a12 a24)/(a12 + a13)(a21 + a24), neglecting higher order transitions such as 1 → 2 → 1 → 2 → 4.
Figure 3
Figure 3
(A) Three simulation runs for the onset of P1 dimer production for the regulatory configuration in Fig. 1B. Each run is a different realization of the pattern of the dimer concentration growth in an individual cell. The pattern of protein expression can be quite erratic and thus dramatically different in each cell. Rapid changes in dimer concentration due to forward and reverse dimer transitions contribute to the high frequency noise in the protein dimer signal. The broken lines are the declining concentrations equivalent to 25 and 50 dimer molecules in the growing cell. Parameters: P1 dimerization equilibrium constant = 20 nM; dimerization kr = 0.5 s−1; P1 half-life, 30 min. Initial cell volume comparable to E. coli of 1 × 10⁻¹⁵ liters, doubling with linear growth (20) in 45 min (12). (B) Mean and ± 1 σ results for 100 runs at gene dosages of 1, 2, and 4. The “σ” values plotted are the 16th and 84th concentration percentiles at each time point. At higher gene dosages, protein P1 is being produced from more genes; the concentration rises more rapidly, and the effective concentration range will be reached quicker. In addition, the dispersion in time to effectiveness (i.e., the switching delay) will be lower for faster growing signals. (C) Activation level of a controlled promoter (e.g., PRP3 in Fig. 1) assuming activation, A, is characterized by the Hill equation with Hill coefficient 2: A = (Kh[P1P1]2)/(1 + Kh[P1P1]2) where [P1P1] is the P1 dimer concentration and Kh is the Hill association constant, Kh = [KE]−2. Curves are labeled by N;KE, where N is the gene dosage and KE is the dimer-operator binding constant. Each curve reflects only the mean concentration curve plotted in B. Activation (or repression) of controlled genes in each cell and over the population will differ widely around this mean value as shown in A and B.

References

    1. Collado-Vides J, Magasanik B, Gralla J D. Microbiol Rev. 1991;55:371–394. - PMC - PubMed
    1. Chapon C. EMBO J. 1982;1:369–374. - PMC - PubMed
    1. Yarchuk O, Jacques N, Guillerez J, Dreyfus M. J Mol Biol. 1992;226:581–596. - PubMed
    1. Halling P J. Trends Biochem Sci. 1989;14:317–318. - PubMed
    1. Spudich J L, Koshland D E., Jr Nature (London) 1976;262:467–471. - PubMed

Publication types