. 1997 Feb 4;94(3):1013-8.
doi: 10.1073/pnas.94.3.1013.

Reconstitution of stretch-activated cation channels by expression of the alpha-subunit of the epithelial sodium channel cloned from osteoblasts

Affiliations

Reconstitution of stretch-activated cation channels by expression of the alpha-subunit of the epithelial sodium channel cloned from osteoblasts

N Kizer et al. Proc Natl Acad Sci U S A. .

Erratum in

  • Proc Natl Acad Sci U S A 1997 Apr 15;94(8):4233

Abstract

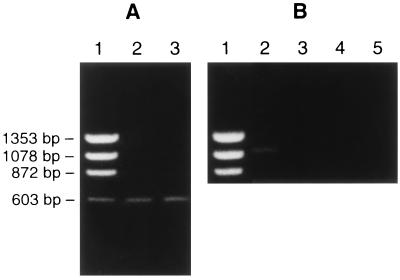
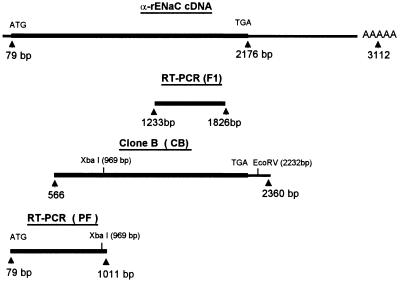
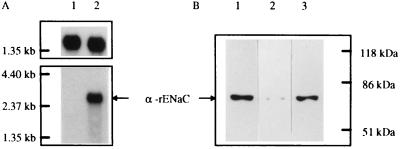
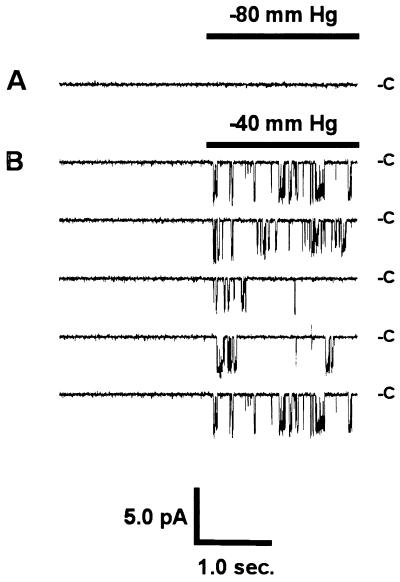
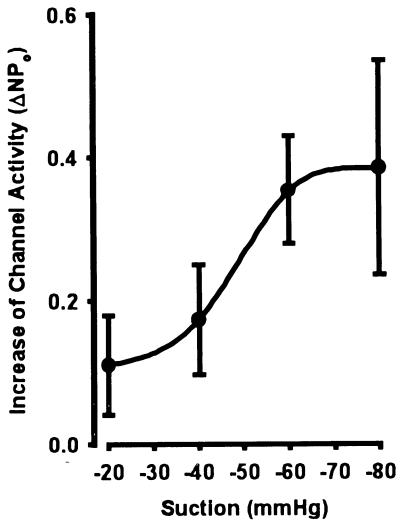
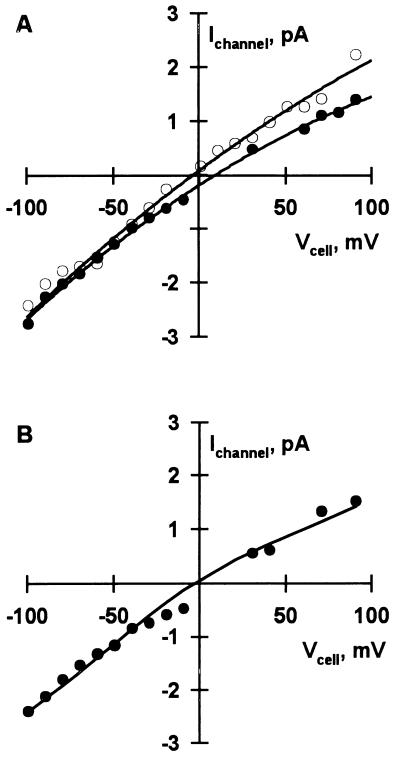
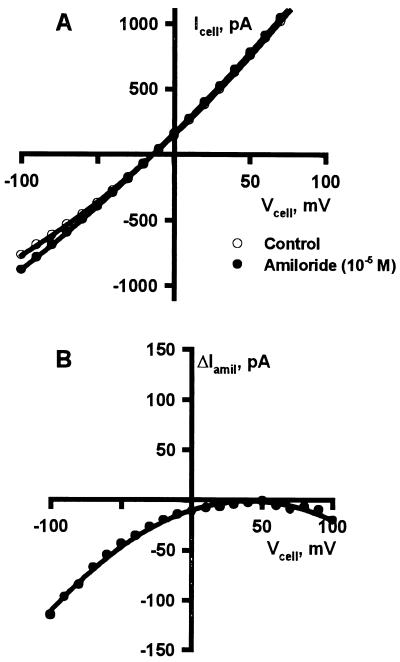
Osteoblasts respond to repetitive strain by activating stretch-activated, nonselective cation channels (SA-CAT) and increasing matrix protein production. SA-CAT channels are thought to be responsible for mechano-transduction in osteoblasts, although the molecular identity of the SA-CAT channel has previously been unknown. We have demonstrated that both the UMR-106 osteoblast-like cell line and human osteoblasts in primary culture express the alpha-subunit of the epithelial sodium channel (alpha-ENaC). The ENaC gene product is closely related to a class of proteins that confer touch sensitivity to Caenorhabditis elegans and are referred to as degenerins. A cDNA clone was obtained of the entire coding region of rat alpha-ENaC (alpha-rENaC). Sequence analysis indicated that the osteoblast clone's sequence was identical to that originally cloned from rat colon. The alpha-rENaC cDNA was cloned into an expression plasmid and transfected into LM(TK-) cells, a null cell for SA-CAT activity. Stable transfectants expressed mRNA and the expected 74-kDa protein corresponding to alpha-rENaC. Reconstitution of alpha-rENaC resulted in the expression of a 24.2 +/- 1.0 psec SA-CAT channel (P(Na):P(K) = 1.1 +/- 0.1). The channel is calcium permeable (P(Na):P(Ca) = 1.4 +/- 0.1) and highly selective for cations over anions (P(Na):P(Cl) >> 20). The channel is only active after negative pressure is applied to cell attached patches, cell swelling, or patch excision. These results represent the first heterologous expression of an SA-CAT channel in a mammalian cell system and provide evidence that the ENaC/degenerin family of proteins are capable of mediating both transepithelial sodium transport and are involved in signal transduction by mechano-sensitive cells such as osteoblasts.


Figures

Figure 1
Figure 1
Analysis of RT-PCR products from UMR-106.01 cells and primary cultures of HBMC indicating the presence or absence of expression of α-, β-, or γ-ENaC mRNA. (A) Lanes: 1, DNA molecular weight markers; 2, expected 0.6-kb α-rENaC product from UMR-106.01 cell RNA; 3, expected 0.6-kb α-hENaC product from HBMC RNA. (B) Lanes: 1, DNA molecular weight markers; 2, expected 1.1-kb β-rENaC product from UMR-106.01 cell RNA; 3, no RT control for β-rENaC product from UMR-106.01 cell RNA; 4, negative result for the expected 1.1-kb γ-rENaC product from UMR-106.01; 5, no RT control for γ-rENaC product from UMR-106.01 cell RNA.
Figure 2
Figure 2
Schematic maps of α-rENaC cDNA, cDNA cloned from a UMR-106.01 cDNA library, and RT-PCR fragments from UMR-106.01 poly(A) RNA. Numbering of bases is according to α-rENaC cDNA (20). Thick lines indicate the coding region and thin lines indicate the untranslated region. Restriction enzymes are illustrated by the smaller text above the bars, with the site of cleavage indicated by a base pair number in parentheses.
Figure 3
Figure 3
(A) Northern blot analysis of α-rENaC mRNA expression. Each lane contained 2 μg of poly(A+) RNA. Lane 1, LM/pCEP4 cells; lane 2, LM/α-rENaC cells. Molecular mass markers are shown on left. Membrane was first hybridized with α-rENaC cDNA probe (Lower). The same membrane was stripped and reprobed with glyceraldehyde phosphate dehydrogenase cDNA (Upper) to verify equal mRNA loading. (B) Immunoblot analysis for α-rENaC protein in UMR-106.01 cells (lane 1), LM/pCEP4 cells (lane 2), and LM/α-rENaC cells (lane 3). Molecular mass markers are shown on right.
Figure 4
Figure 4
(A) Single-channel current records from cell-attached patches of LM(TK) fibroblasts. In the parent cell line and LM/pCEP4 transfected cells no SA-CAT activity was observed at negative pressures from 0 mmHg to −90 mmHg. (B) LM/α-rENaC cells expressed SA-CAT channel activity at negative pipet pressures greater than −30 mmHg. Records shown were recorded sequentially during a 2-sec on/2-sec off square wave pulse of regulated negative pressure applied to the patch pipet through a computer-controlled solenoid valve. Current level measured when channels were closed is indicated by C and downward deflections indicate individual channel openings. The patch was hyperpolarized by 50 mV relative to the cell.
Figure 5
Figure 5
Increase in channel activity in cell-attached patches of LM/α-rENaC transfected cells plotted as a function of negative pipet pressure. Data were calculated by comparing NPo before and after a 2-sec square wave pulse of regulated negative pressure applied to the patch pipet through a computer-controlled solenoid valve. Patches (n = 15) were hyperpolarized by 50 mV relative to the cell. All increases of NPo were significantly different from control (P < 0.05).
Figure 6
Figure 6
Typical current–voltage (I–V) plots of single channels observed in LM/α-rENaC cells. Pipet solution was constant throughout experiment and contained: 142 mM NaCl, 5.5 mM KCl, 1 mM MgCl2, 2 mM EGTA, 8 mM Hepes (pH 7.4). Data were fit to a modified GHK equation (34), which permitted calculation of PNa and selectivity ratios for K+, Ca2+, and Cl. (A) Open circles represent single-channel currents obtained with a bath solution containing: 144 mM KCl, 1 mM MgCl2, 10 mM Hepes (pH 7.3). Note that the reversal potential near 0 mV indicates a selectivity ratio, PNa:PK ≈ 1. Solid circles represent single-channel currents obtained with a bath solution containing: 65 mM NaCl, 5.5 mM KCl, 1 mM MgCl2, 1 mM CaCl2, 2 mM EGTA, 154 mM mannitol, 8 mM Hepes (pH 7.4). Note that the reversal potential shift to more positive potentials was nearly equal to the theoretical limit of 17 mV indicating a cation-selective channel, PNa:PCl > 20. (B) I–V plot obtained with a bath solution containing: 75 mM CaCl2, 5.5 mM KCl, 1 mM MgCl2, 60 mM mannitol, 8 mM Hepes (pH 7.4). The channel had a PNa = 2.7 × 10⁻⁸ cm/sec and a PNa:PCa = 1.2.
Figure 7
Figure 7
Representative I–V plots of amiloride-sensitive, whole-cell currents observed in LM/α-rENaC cells. (A) I–V plots of whole-cell currents prior to (open circles) and after (solid circles) exposure to amiloride. (B) Plot of the difference in current at each voltage in A to illustrate the voltage-dependent block observed. Cells were swollen by exposure to a 185 mOsm/kg bath solution containing: 65 mM NaCl, 5.5 mM KCl, 1 mM MgCl2, 1 mM CaCl2, 2 mM EGTA, 30 mM mannitol, 8 mM Hepes (pH 7.4). After the swelling-induced increase in cell conductance reached steady-state values and control I–V curves were recorded, amiloride (10 μM) was added. I–V relations recorded after addition of amiloride were subtracted from control curves and the resulting difference plots are illustrated.

References

    1. Yang X, Sachs F. Science. 1989;243:1068–1071. - PubMed
    1. Brehm P, Kullberg R, Moody-Corbett F. J Physiol (London) 1984;350:631–648. - PMC - PubMed
    1. Guharay F, Sachs F. J Physiol (London) 1984;352:685–701. - PMC - PubMed
    1. Kirber M T, Walsh J V, Singer J J. Pflügers Arch. 1988;412:339–345. - PubMed
    1. Falke L, Misler S. Proc Natl Acad Sci USA. 1989;86:3919–3923. - PMC - PubMed

Publication types

LinkOut - more resources