. 1997 Mar 1;17(5):1869-79.
doi: 10.1523/JNEUROSCI.17-05-01869.1997.

Sleep and sleep regulation in normal and prion protein-deficient mice

Affiliations

Sleep and sleep regulation in normal and prion protein-deficient mice

I Tobler et al. J Neurosci. .

Abstract

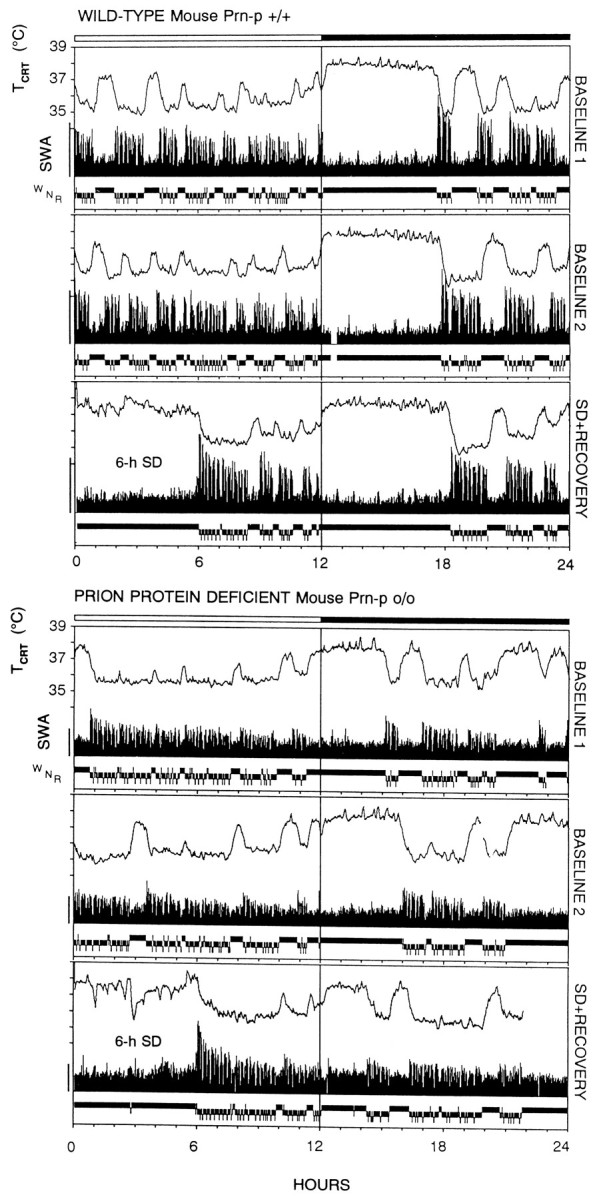
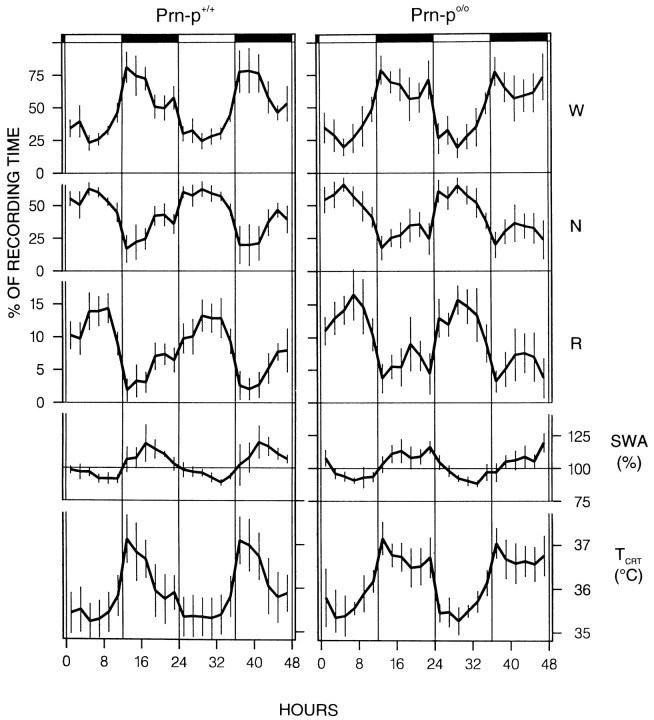
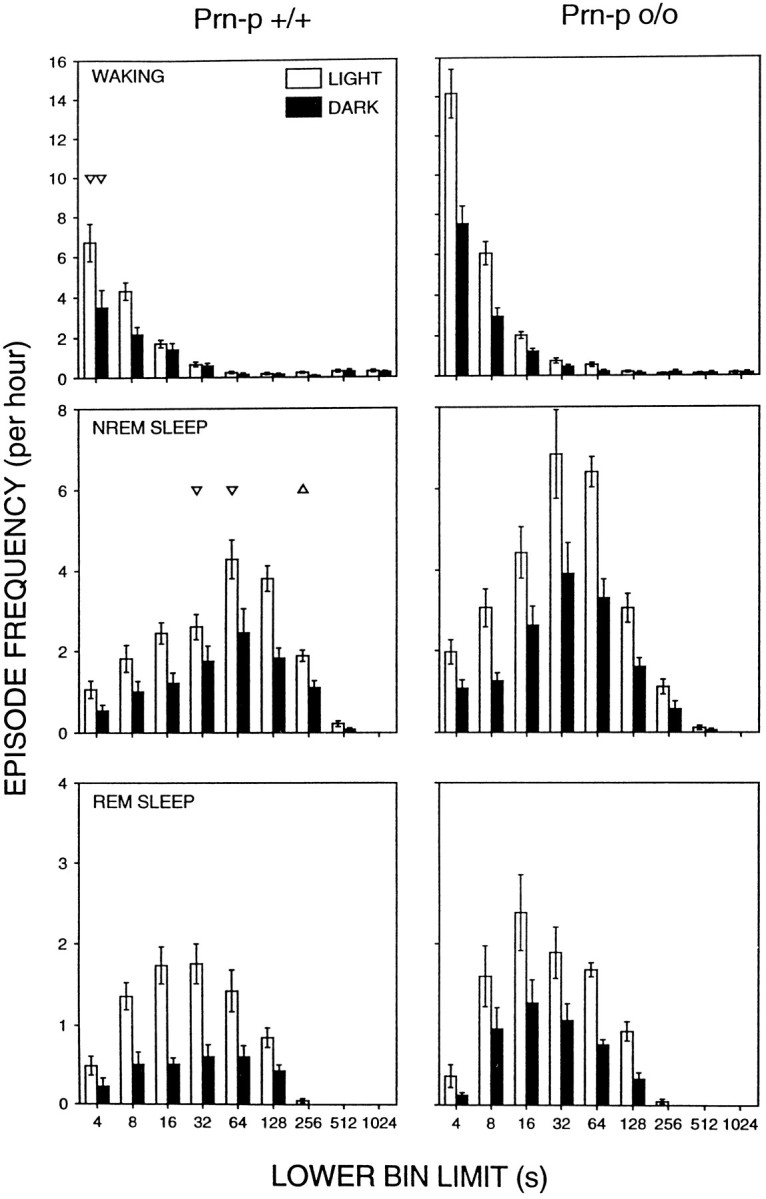
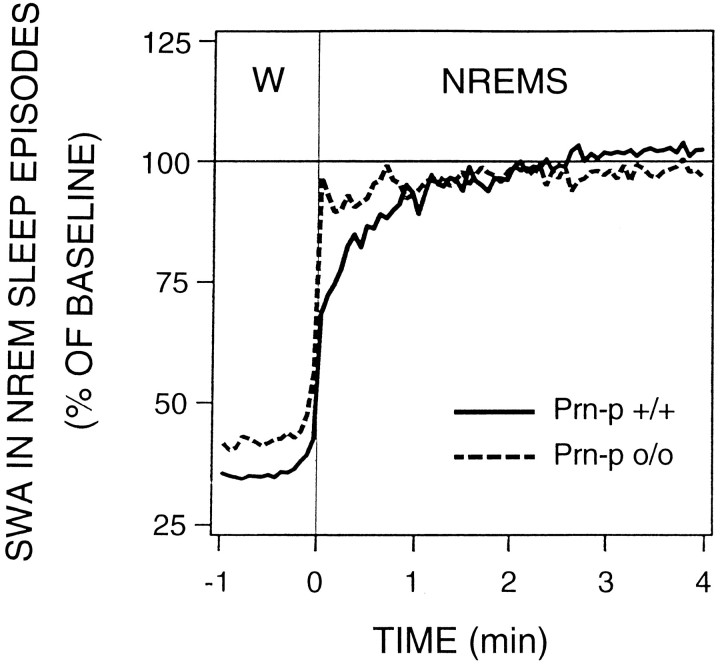
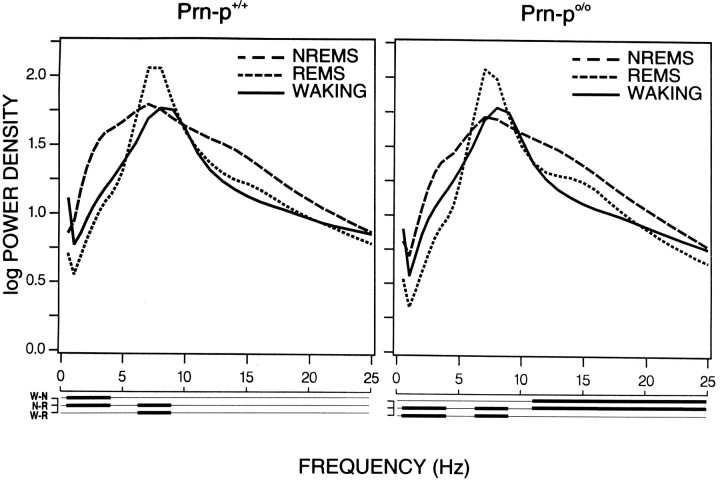
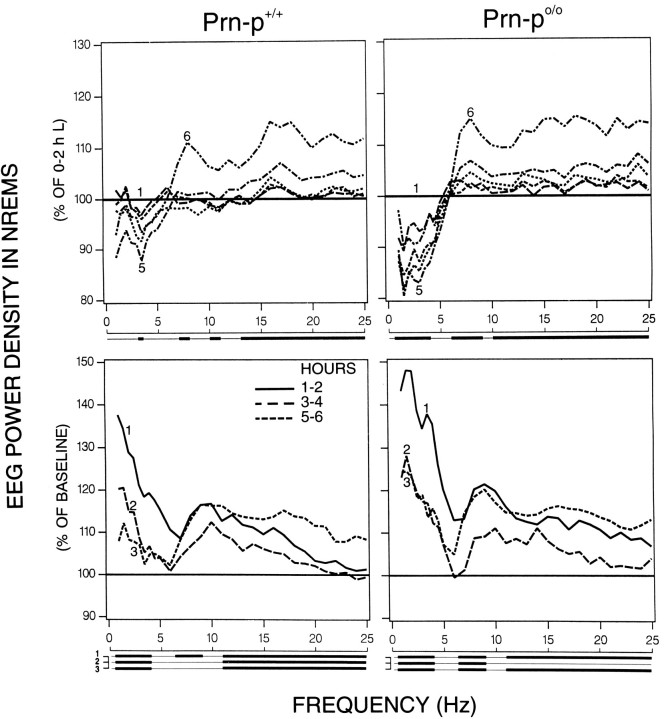
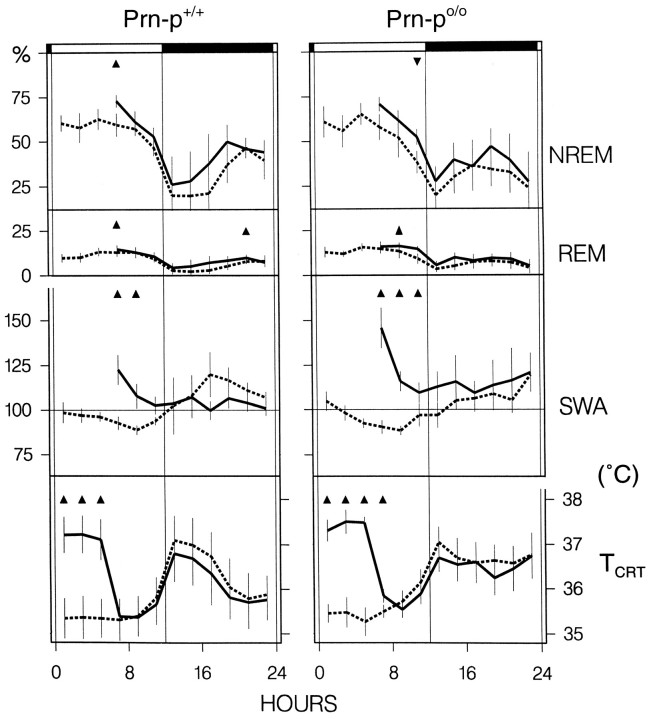
Mice are the preferred mammalian species for genetic investigations of the role of proteins. The normal function of the prion protein (PrP) is unknown, although it plays a major role in the prion diseases, including fatal familial insomnia. We investigated its role in sleep and sleep regulation by comparing baseline recordings and the effects of sleep deprivation in PrP knockout mice (129/SV) and wild-type controls (129/SV x C57BL/6), which are the mice used for most gene targeting experiments and whose behavior is not well characterized. Although no difference was evident in the amount of vigilance states, the null mice exhibited a larger degree of sleep fragmentation than the wild-type with almost double the amount of short waking episodes. As in other rodents, cortical temperature closely reflected the time course of waking. The increase of slow-wave activity (SWA; mean EEG power density in the 0.25-4.0 Hz range) at waking to nonrapid eye movement (NREM) sleep transitions was faster and reached a lower level in the null mice than in the wild-type. The contribution of the lower frequencies (0.25-5.0 Hz) to the spectrum was smaller than in other rodents in all three vigilance states, and the distinction between NREM sleep and REM sleep was most marked in the theta band. After the sleep deprivation, SWA was increased, but the changes in EEG power density and SWA were more prominent and lasted longer in the PrP-null mice. Our results suggest that PrP plays a role in promoting sleep continuity.


Figures

Fig. 1.
Fig. 1.
Individual 24 hr sleep and brain temperature records of the two genotypes. Individual 3 d records (baseline 1, baseline 2, and day 3 consisting of sleep deprivation and recovery) of a wild-type (Prn-p+/+) and a prion protein-deficient mouse (Prn-p0/0). Cortical temperature (TCRT), slow-wave activity (SWA; EEG power density 0.75–4.0 Hz) in NREM sleep (N), and the vigilance states waking (W), N, and REM sleep (R). The bars at the top mark the 12 hr light/dark cycle. The calibration mark on theleft corresponds to 50 μV2.
Fig. 2.
Fig. 2.
Distribution of the vigilance states and brain temperature across the two baselines. Vigilance states (W, waking; N, NREM sleep; R, REM sleep), slow-wave activity (SWA; power density 0.75–4.0 Hz inN), and cortical temperature (TCRT) for the 48 hr baseline recording in Prn-p+/+ and Prn-p0/0 mice. Mean 2 hr values ± 2 SEM, n = 8 for each strain (1 Prn-p+/+ mouse contributed with 1 baseline). ANOVA factor “genotype” (Prn-p+/+ vs Prn-p0/0) was not significant for all 12 and 24 hr variables.
Fig. 3.
Fig. 3.
Episode frequency histogram of the three vigilance states. Waking, NREM sleep, and REM sleep episodes during the light (open bars) and dark period (black bars) of baseline 2 for the Prn-p+/+ and Prn-p0/0 mice. Time bins are shown with logarithmically increasing size. The inclusive range of eight consecutive bins was: 4, 8–12, 16–28, 32–60, 64–124, 128–252, 512–1020, and 1024–2048 sec. Bars represent means ± SEM of 8 animals. The abscissae denote lower bin limits.Triangles indicate significant differences between the two genotypes (p < 0.005, two-tailed ttest after Bonferroni correction). Orientation of triangles indicates the direction of deviation.
Fig. 4.
Fig. 4.
Time course of slow-wave activity within NREM sleep episodes. SWA, Mean EEG power density in the 0.75–4.0 Hz band. All NREM sleep episodes of the light period of baseline 2 lasting at least 4 min were pooled for each mouse. The curves connect mean 4 sec bins for 1 min before and 4 min after the transition from waking to NREM sleep separately for each genotype (n = 8 mice per genotype). The curves are expressed as a percentage of the 24 hr baseline value for each genotype. The genotypes differed significantly in the first 1 min interval after the transition (p = 0.004, two-tailed t test), whereas the 1 min interval before the transition was not significant (p = 0.083).
Fig. 5.
Fig. 5.
Spectral distribution of EEG power density in the three vigilance states. Waking (W), NREM sleep (N), and REM sleep (R) for Prn-p+/+ and Prn-p0/0 mice computed for pooled 24 hr values of Baseline 1 and 2. The curves represent logarithmic mean values of absolute power densities (log μV2/0.25 Hz,n = 8 for each genotype, except n = 7 for Baseline 1, Prn-p+/+). Lines below the abscissa indicate frequency bands that differ significantly between two vigilance states (p < 0.05, two-tailedt test).
Fig. 7.
Fig. 7.
Time course of EEG power density in NREM sleep.Top, Light period of baseline 2 (six 2 hr intervals;16). Bottom, Light period after sleep deprivation (three 2 hr intervals; 1–3) for the Prn-p+/+ and Prn-p0/0 mice. The curves connect geometric means of relative EEG power density for consecutive 2 hr intervals (n = 8 for each genotype). Values are plotted at the upper limit of each bin. The baseline data are expressed relative to the first 2 hr interval of the light period (=100%). Consecutive 2 hr intervals of recovery are expressed relative to the first three consecutive 2 hr intervals of the light period of Baseline 2 (=100%). Lines below the abscissa indicate frequency bands that differed significantly from 100% (p< 0.05, top, one-way ANOVA “2 hr intervals”;bottom, frequency bands: 0.5–4.0, 6.25–9.0, 11.25–25 Hz; two-tailed t test).
Fig. 6.
Fig. 6.
Effects of sleep deprivation on sleep and brain temperature. Vigilance states, slow-wave activity (SWA; mean EEG power density in the 0.75–4.0 Hz band), and cortical temperature (TCRT) for the Prn-p+/+ and Prn-p0/0 mice. The curves represent 2 hr mean values ± 2 SEM (n = 8 for each genotype) for Baseline 2 (dashed lines), 6 hr sleep deprivation, and recovery (solid lines). SWA is expressed as 95% of mean 24 hr value (=100%). Triangles indicate significant differences within a genotype between recovery and baseline (p < 0.05; two-tailed t test, after Bonferroni correction). For the vigilance states and SWA, the 2 hr recovery intervals of the light period were compared with consecutive intervals of baseline beginning with lights on. For TCRT, all intervals were compared with baseline intervals corresponding to the time of day.

References

    1. Achermann P, Dijk DJ, Brunner DP, Borbély AA. A model of human sleep homeostasis based on EEG slow-wave activity: quantitative comparison of data and simulations. Brain Res Bull. 1993;31:97–113. - PubMed
    1. Aguzzi A, Weissmann C. Sleepless in Bologna: transmission of fatal familial insomnia. Trends Microbiol. 1996;4:129–131. - PubMed
    1. Aeschbach D, Cajochen C, Landolt HP, Borbély AA. Homeostatic sleep regulation in habitual short sleepers and long sleepers. Am J Physiol. 1996;270:41–53. - PubMed
    1. Borbély AA. Sleep homeostasis and models of sleep regulation. In: Kryger MH, Roth T, Dement WC, editors. Principles and practice of sleep medicine, 2nd Ed. Saunders; Philadelphia: 1994. pp. 309–320.
    1. Borbély AA, Baumann F, Brandeis D, Strauch I, Lehmann D. Sleep deprivation: effect on sleep stages and EEG power density in man. Electroencephalogr Clin Neurophysiol. 1981;51:483–493. - PubMed

Publication types

LinkOut - more resources