Comparative Study
. 1997 Feb 18;94(4):1166-71.
doi: 10.1073/pnas.94.4.1166.

In vivo control of respiration by cytochrome c oxidase in wild-type and mitochondrial DNA mutation-carrying human cells

Affiliations
Comparative Study

In vivo control of respiration by cytochrome c oxidase in wild-type and mitochondrial DNA mutation-carrying human cells

G Villani et al. Proc Natl Acad Sci U S A. .

Abstract

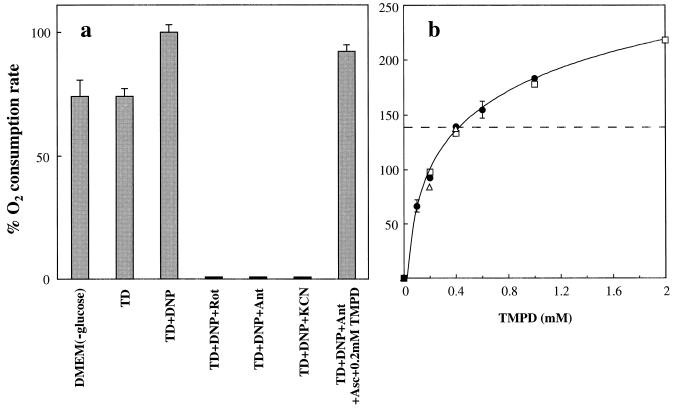
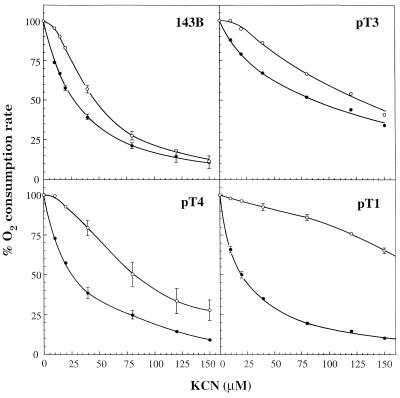
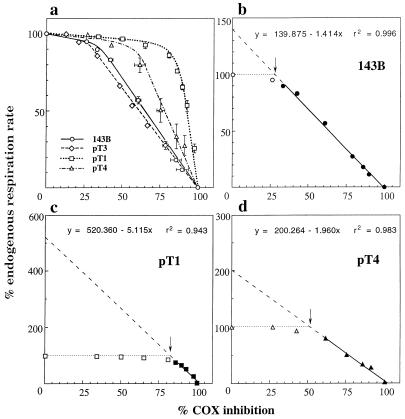
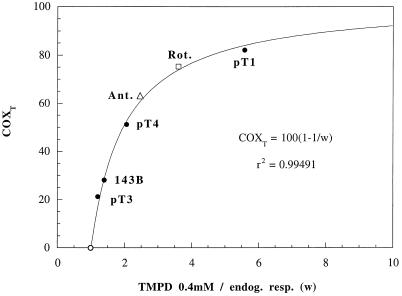
The metabolic control of respiration is still poorly understood, due mainly to the lack of suitable approaches for studying it in vivo. Experiments on isolated mammalian mitochondria have indicated that a relatively small fraction of each of several components of the electron transport chain is sufficient to sustain a normal O2 consumption rate. These experiments, however, may not reflect accurately the in vivo situation, due to the lack in the mitochondrial fraction of essential cytosolic components and to the use of excess of substrates in the in vitro assays. An approach is described here whereby the control of respiration by cytochrome c oxidase (COX; EC 1.9.3.1) was analyzed in intact cultured human osteosarcoma 143B.TK- cells and other wild-type cells and in mitochondrial DNA mutation-carrying human cell lines. Surprisingly, in wild-type cells, only a slightly higher COX capacity was detected than required to support the endogenous respiration rate, pointing to a tighter in vivo control of respiration by COX than generally assumed. Cell lines carrying the MERRF mitochondrial tRNA(Lys) gene mutation, which causes a pronounced decrease in mitochondrial protein synthesis and respiration rates, revealed, in comparison, a significantly greater COX capacity relative to the residual endogenous respiration rate, and, correspondingly, a higher COX inhibition threshold above which the overall respiratory flux was affected. The observed relationship between COX respiratory threshold and relative COX capacity and the potential extension of the present analysis to other respiratory complexes have significant general implications for understanding the pathogenetic role of mutations in mtDNA-linked diseases and the tissue specificity of the mutation-associated phenotype.


Figures

Figure 1
Figure 1
Measurements of endogenous respiration rate or (ascorbate + TMPD)-dependent respiration rate by intact 143B.TK cells. (a) Relative oxygen consumption rate by cells in DMEM lacking glucose, or in TD buffer in the absence or presence of DNP, or in TD buffer in the presence of DNP and either rotenone (Rot) or antimycin A (Ant) or KCN, or in TD buffer in the presence of DNP, antimycin A, ascorbate, and 0.2 mM TMPD. The data represent the means ± SE obtained in two determinations made in DMEM (−glucose) or TD, 7 determinations in TD+DNP, one determination in TD+ DNP+rotenone, or in TD+DNP+antimycin A, or in TD+DNP+KCN, and 12 determinations in TD+DNP, antimycin A, ascorbate, and 0.2 mM TMPD. (b) Dependence on concentration of TMPD, in the presence of a constant concentration of ascorbate, of the initial oxygen consumption rate associated with isolated COX activity in DNP- and antimycin A-treated 143B.TK cells (•), HeLa cells (□), and the fibroblast cell line 701.2.8c (▵), expressed as a percentage of the endogenous rate. The data shown represent the means ± SE obtained in 2–12 determinations on 143B cells tested at each of different concentrations of TMPD (the error bars that fall within the individual data symbols are not shown), or the results of single determinations on HeLa cells or 7012–8c cells.
Figure 2
Figure 2
Inhibition by KCN of endogenous respiration rate in TD buffer in the presence of DNP (○), or of (ascorbate + 0.2 mM TMPD)-dependent respiration rate in TD buffer in the presence of DNP and antimycin A (•), in intact 143B.TK cells and transmitochondrial human cell lines carrying mtDNA with the mitochondrial tRNALys gene mutation (pT1, pT4) or wild-type mtDNA (pT3), derived from a patient affected by the MERRF encephalomyopathy (8). The data shown represent the means ± SE obtained in six or seven determinations on 143B cells, three determinations on pT1 cells, and four determinations on pT4 cells (the error bars that fall within the limits of the individual data symbols are not shown), or the results of a single determination on pT3 cells.
Figure 3
Figure 3
Percentage of endogenous respiration rate as a function of percent of COX inhibition in intact 143B.TK cells (○) and pT1 (□), pT3 (⋄), and pT4 (▵) transmitochondrial cell lines (a), and maximum COX capacity in 143B.TK (b), pT1 (c), and pT4 cells (d). (a) The values (either means ± SE obtained in several experiments with 143B.TK cells, pT1, and pT4 cells shown in Fig. 2, or values obtained in a single experiment with pT3 cells) for percent of endogenous respiration rate and percent of COX inhibition at each KCN concentration are plotted against each other. (b–d) The percent rates of endogenous respiration in the experiments using 143B, pT1, and pT4 cells illustrated in a are plotted against percent of COX inhibition by KCN, and the least-square regression line through the symbols (filled) beyond the inflection point of each curve (arrow) is extended to zero COX inhibition. The equations describing these extrapolated lines and the probability of the data fitting are shown.
Figure 4
Figure 4
Relationship of COX respiratory threshold (COXT) to relative COX capacity. The data for COX thresholds derived from the COX inhibition data in wild-type 143B and pT3 cells, mutant pT1 and pT4 cells (Fig. 3 and Table 1), and 3 nM rotenone- or 2.7 nM antimycin A-treated 143B cells (Table 1) are plotted against the ratios of (ascorbate + 0.4 mM TMPD)-dependent O2 consumption rate to endogenous respiration rate (TMPD 0.4 mM/endog. resp.).

References

    1. Kacser H, Burns J A. In: Rate Control of Biological Processes. Davies D D, editor. Cambridge, U.K.: Cambridge Univ. Press; 1973. pp. 65–104.
    1. Heinrich R, Rapoport T A. Eur J Biochem. 1974;42:89–95. - PubMed
    1. Groen A K, Wanders R J A, Westerhoff H V, Van der Meer R, Tager J M. J Biol Chem. 1982;257:2754–2757. - PubMed
    1. Letellier T, Malgat M, Mazat J-P. Biochim Biophys Acta. 1993;1141:58–64. - PubMed
    1. Letellier T, Heinrich R, Malgat M, Mazat J-P. Biochem J. 1994;302:171–174. - PMC - PubMed

Publication types

MeSH terms

LinkOut - more resources