. 1997 Feb 18;94(4):1200-5.
doi: 10.1073/pnas.94.4.1200.

Hepatitis C virus core protein shows a cytoplasmic localization and associates to cellular lipid storage droplets

Affiliations

Hepatitis C virus core protein shows a cytoplasmic localization and associates to cellular lipid storage droplets

G Barba et al. Proc Natl Acad Sci U S A. .

Abstract

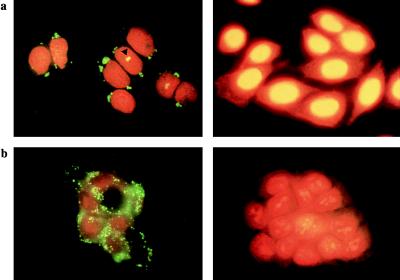
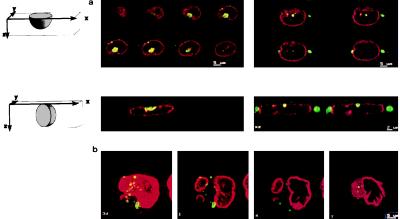
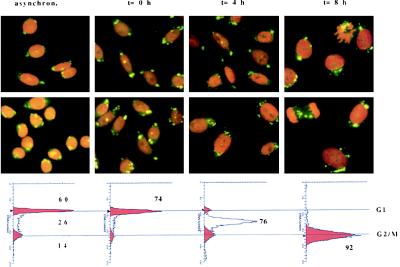
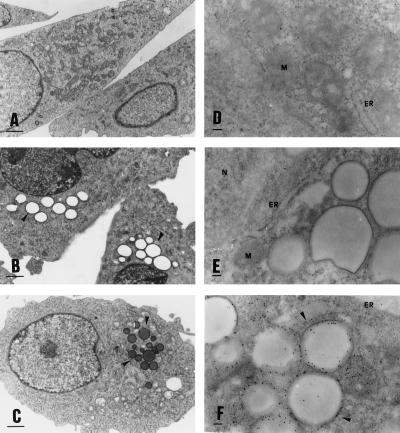
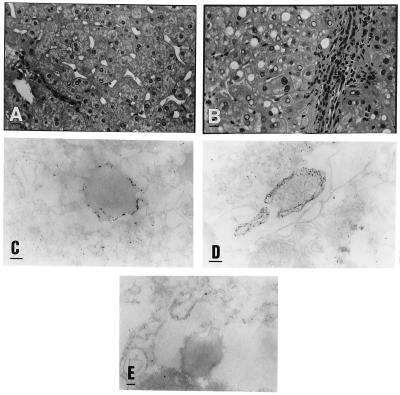
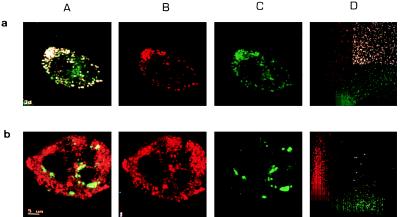
There is now abundant evidence to substantiate an important role of hepatitis C virus (HCV) core protein in cellular gene expression as well as in the viral cycle. Thus the subcellular localization of this protein has important implications. However, several studies have shown controversial results: the HCV core has been, indeed, described as cytoplasmic or nuclear depending on the size of the protein or on the genotype analyzed. We have studied the localization of the HCV core protein in two different cell lines, one nonhepatic (CHO) and the other hepatic (HepG2). Double immunofluorescence staining using a nuclear membrane marker and confocal analysis showed the core protein pattern to be cytoplasmic and globular. This pattern is not cell cycle-regulated. Electron microscopy analysis revealed the nature of the globular staining observed in immunofluorescence. The HCV core protein accumulated at the surface of lipid droplets that were also the unique morphological feature of nonhepatic core transfected cells. The lipid droplets were isolated by sequential ultracentrifugation on the basis of their density; biochemical analysis revealed a prevalence of triglycerides. In addition the core protein colocalized with apolipoprotein AII at the surface of the lipid droplets as revealed by confocal microscopy. Moreover analysis of liver biopsies from chronically HCV-infected chimpanzees revealed that HCV core is cytoplasmic and localized on the endoplasmic reticulum and on lipid droplets. These results clearly define the subcellular localization of the HCV core protein and suggest a relationship between the expression of the HCV core protein and cellular lipid metabolism.


Figures

Figure 1
Figure 1
Indirect immunofluorescence analysis to detect the HCV core protein. (a) CHO cells expressing the HCV core protein (Left) and negative control (Right). The triangle shows the superposition between the core protein and the nucleus. (b) HepG2 cells expressing the HCV core protein (Left) and negative control (Right).
Figure 2
Figure 2
Confocal analysis of double immunofluorescence in CHO cells stained for the HCV core and the nuclear membrane marker lamin B. (a Upper) Horizontal sections of 0.5 μm each of two cells with the core protein in the nucleus. (Lower) Vertical sections of 0.3 μm of the same cells. The core protein is visible on the cytoplasmic site of the nuclear membrane and has been never found in the nucleus. (b) Explanation of the pseudo-nuclear localization of the core protein. Shown from left to right are superposition of all the slices: the core protein seems to be in the nucleus; successive slices from the bottom of the cell: the core protein is in the cytoplasm and lies in a nuclear invagination.
Figure 3
Figure 3
Indirect immunofluorescence analysis of synchronized CHO cells. (Lower) Schematic representation of the synchronization obtained by plotting the DNA content against the number of cells. The number indicates the percent of cells in a specific phase of the cell cycle. The immunofluorescence analysis shows that the core protein does not change its globular perinuclear distribution during the different phases of the cell cycle.
Figure 4
Figure 4
Electron microscopy analysis of core-expressing CHO cells. (Left) (A) CHO-negative control cells. (B) Core-expressing CHO cells fixed only with glutaraldehyde. (C) Core-expressing CHO cells fixed with glutaraldehyde and postfixed with osmic acid. Only the core-expressing cells show an accumulation in the cytoplasm of droplets that show a lipid content only by a fixation which preserve lipids as the osmic staining. (×8000; bar = 1 μm.) (Right) (D) CHO-negative control cells fixed with paraformaldehyde and immunostained by an anticore mAb. (E) Core-expressing CHO cells immunostained by normal mouse serum. (F) Core-expressing CHO cells immunostained by an anticore mAb. The two negative controls show absence of unspecific staining. The core protein is concentrated on the surface of the lipid droplets, and only minor staining is present on the endoplasmic reticulum (ER). (×45,000; bar = 0.1 μm.)
Figure 5
Figure 5
(A) Normal liver tissue taken from an uninfected chimpanzee (F4). (B) Liver tissue taken from a chimpanzee (E5) chronically infected with HCV. Inflammatory infiltration in the portal area, fatty degeneration of the hepatocytes. (×320; bar = 20 μm.) (C) Immunostaining with an anticore mAb. Shown are 10 nm gold particles surrounding a lipid droplet located in the cytoplasm of an hepatocyte taken from an HCV-infected chimpanzee. (D) Accumulation of gold particles in an hepatocyte along the membrane of the ER taken from a chimpanzee infected with HCV. (×78,000; bar = 0.1 μm.) (E) Negative control. Part of the cytoplasm of an hepatocyte taken from an HCV-infected chimpanzee (E5). No primary antibody to core was applied. No accumulation of gold particles around the lipid droplets (not contrasted). (×58,900; bar = 0.1 μm.)
Figure 6
Figure 6
(a) Confocal analysis of double immunofluorescence staining for the HCV core and apoAII in HepG2 cells. Lanes: A, superposition of the staining for HCV core and apoAII; B, HCV core protein stained by Texas-red; C, apoAII stained by fluorescein; D, cytofluorogram. The cytofluorogram was obtained by plotting for each point of the cell the fluorescence green on the x axis and the fluorescence red on the y axis. Colocalization is indicated from the white points (strongest fluorescence green and red), and from the general shape of the graphic, the points are indeed concentrated on the diagonal of the graphic meaning that the most points are fluorescent for both fluorochromes. (b) Confocal analysis of double immunofluorescence staining for the HCV core and apoAI in HepG2 cells. Lanes: A, superposition of the staining for HCV core and apoAI; B, HCV core protein stained by Texas-red; C, apoAI stained by fluorescein; D, cytofluorogram. Only few points show a superposition of the red and green fluorescence. The cytofluorogram shows two different peaks for the red and the green fluorescence, indicating no colocalization.

References

    1. Choo Q-L, Kuo G, Weiner A J, Overby L R, Bradley D W, Houghton M. Science. 1989;244:359–362. - PubMed
    1. Miller R H, Purcell R H. Proc Natl Acad Sci USA. 1990;87:2057–2061. - PMC - PubMed
    1. Han J H, Shyamala V, Richman K H, Brauer M J, Irvine B, Urdea M S, Tekamp-Olson P, Kuo G, Choo Q-L, Houghton M. Proc Natl Acad Sci USA. 1991;88:1711–1715. - PMC - PubMed
    1. Tanaka T, Kato N, Cho M-J, Sugiyama K, Shimotohno K. J Virol. 1996;70:3307–3312. - PMC - PubMed
    1. Houghton M, Weiner A, Han J, Kuo G, Choo Q-L. Hepatology. 1991;14:381–388. - PubMed

Publication types

MeSH terms

LinkOut - more resources