. 1997 Feb 18;94(4):1304-9.
doi: 10.1073/pnas.94.4.1304.

High-resolution functional mapping of a cloned gene by genetic footprinting

Affiliations

High-resolution functional mapping of a cloned gene by genetic footprinting

I R Singh et al. Proc Natl Acad Sci U S A. .

Abstract

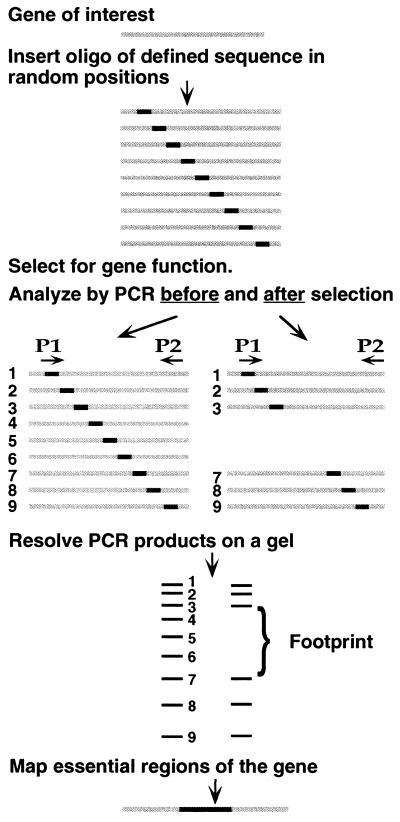
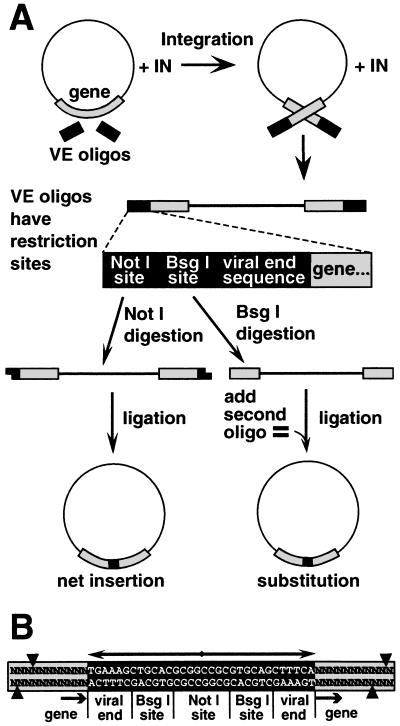
We describe an efficient method for introducing and analyzing a comprehensive set of mutations in a cloned gene to map its functional organization. The technique, genetic footprinting, uses a retroviral integrase to generate a comprehensive library of mutants, each of which bears a single insertion of a defined oligonucleotide at a random position in the gene of interest. This mutant library is selected for gene function en masse. DNA samples are isolated from the library both before and after selection, and the mutations represented in each sample are then analyzed. The analysis is designed so that a mutation at a particular location gives rise to an electrophoretic band of discrete mobility. For the whole library, this results in a ladder of bands, each band representing a specific mutation. Mutants in which the inserted sequence disrupts a feature that is required for the selected function, ipso facto, fail the selection. The corresponding bands are therefore absent from the ladder of bands obtained from the library after selection, giving rise to a footprint representing features of the gene that are essential for the selected function. Because the sequence of the inserted oligonucleotide is known, and its position can be inferred precisely from the electrophoretic mobility of the corresponding band, the precise location and sequence of mutations that disrupt gene function can be determined without isolating or sequencing individual mutants. This method should be generally applicable for saturation mutagenesis and high-resolution functional mapping of cloned DNA sequences.


Figures

Figure 1
Figure 1
The principle of genetic footprinting. Starting with a cloned gene, a comprehensive library of mutants is made by inserting a defined oligonucleotide duplex at random positions. The library of mutants is subjected to a selection for a function of the gene. DNA made from the library of mutants both before and after selection is analyzed by PCR. P1 is the primer corresponding to the inserted oligonucleotide. P2 is a labeled primer that primes from a site just outside the gene. The products run as a ladder of bands on a sequencing gel, each band corresponding to at least one independent mutation. Bands representing mutants that fail to survive the selection are absent from the corresponding ladder of PCR products, giving rise to a footprint. Comparing the sizes of the missing bands to a sequencing ladder allows precise determination of the essential feature(s) of the gene.
Figure 2
Figure 2
Strategy for making random insertions. (A) MoMLV integrase inserted oligonucleotide duplexes (VE oligonucleotides) containing terminal sequences from MoMLV DNA ends into diverse sites in a plasmid. Linear DNA products of concerted integration of the VE oligonucleotides were purified and digested with NotI. Intramolecular ligation of the resulting cohesive ends produced a 36-bp insertion in the gene, or elsewhere in the plasmid. Digestion of the concerted integration product with BsgI (lower right) resulted in excision of the integrated oligonucleotide duplex, along with 12 bp of the flanking DNA. (B) Sequence of the insertion mutation and flanking target DNA. Each insertion has a stereotyped structure composed of a 32-bp palindrome (double-headed arrow), containing a NotI site, two BsgI sites, and two copies of sequences representing the ends of MoMLV DNA. Arrows mark the integrase-generated four-base duplication of target DNA sequence. Cleavage directed by the two BsgI sites is depicted by arrowheads, and typically resulted in a 12-bp deletion in the target gene.
Figure 4
Figure 4
The structure of supF and a map of its essential features. The supF tRNA is transcribed as a 128-nucleotide precursor, which is cleaved by RNase P and a 3′-exonuclease (3′-exo) to generate the 85-nucleotide mature tRNA. To the left of the RNA transcript are the promoter elements of the gene. A linear representation of the gene is shown at the top. Mature tRNA sequences are shown in pale gray; precursor sequences that are removed upon processing are shown in darker gray. Footprints are shown in black. Primers used to generate the footprint shown in Fig. 3 hybridized to a site located 160 bp (primer-π267L) or 141 bp (CAM60supF) upstream, or 183 bp downstream (π858U), of the transcription start site. (A) Footprints from the 36-bp insertional mutation library. Footprint 1 extends from nucleotide 46 to nucleotide 126 of the transcript. Footprint 2 extends from nucleotide −9 to nucleotide −29 in the promoter region. (B) Footprints from the substitution mutation library. Footprint 1 extends from nucleotide 35 to nucleotide 129 in the mature tRNA. Footprint 2 in the promoter region is represented by the absence of three bands in positions −7, −9, and −12. The exact boundaries of footprints in this illustration are determined by the set of rules chosen to define them. In A, nucleotides that are partially covered by the footprint represent those that are duplicated by integration events. In B, edges of the footprint are drawn at the internucleotide site corresponding to the right edge of the insertion. In regions where integration was infrequent, the footprint boundary could lie between a band that was retained after selection and one that was a few nucleotides away and was not retained. In such cases, we have chosen to define the margins of the footprints by the nearest bands retained after selection.
Figure 3
Figure 3
Genetic footprinting of supF. (A) Analysis of 36-bp insertional mutations in the plasmid πAN13. DNA from the unselected (U) and selected (S) libraries of mutant supF was used as template for a PCR containing a primer complementary to the insert oligonucleotide, paired with a radiolabeled primer complementary to a region 160 bp upstream of the transcription start site (π267L). A schematic diagram of the supF gene is shown to the right, aligned with the corresponding PCR products. Sequenced plasmid DNA and PCR products from selected sequenced mutations were run adjacent to the footprinted DNA as molecular weight markers and were used to draw the boxes representing various regions of the supF gene (boxes marked −10 and −35 correspond to promoter elements; P, regions of precursor tRNA that are removed upon processing; M, mature tRNA. Black box within the mature tRNA corresponds to the variable loop). (B and C) Analysis of libraries of 36-bp insertional (INS) or 12-bp substitution (SUB) mutations in the plasmid πchloro. In B, the labeled primer (CAM60supF) was complementary to a region 141 bp upstream of the transcription start site; in C, the labeled primer (π858U) was complementary to a region 183 bp downstream of the start site. In lanes 3, 4, 9, and 10, insertional mutants were analyzed by a PCR in which the inserted sequence served as a priming site, as in A. In lanes 5–8 and 11–14, PCR products generated using primers π858U and CAM60supF (one of which was labeled as indicated above) were digested with a restriction endonuclease, whose recognition sequence was unique to the inserted sequence. The ladder (LAD) in lane 15 was generated by pooling 12 unique sequenced clones of replacement mutants that were made in the plasmid πAN13. Ladder DNA was PCR amplified with primer π267L and labeled primer π858U, and digested with a restriction endonuclease as described. (D) The boxed region from lanes 13 and 14 is enlarged to show the PCR products corresponding to substitution mutants replacing all or part of the −10 element. The sequence corresponding to each mutant is indicated to the left with the substituted sequence indicated in boldface type. The wild-type sequence of this region is shown at the bottom, with the −10 element indicated by a box.

References

    1. Huang H V, Little P F, Seed B. Bio/Technology. 1988;10:269–283. - PubMed
    1. Chang A C Y, Cohen S N. J Bacteriol. 1978;134:1141–1156. - PMC - PubMed
    1. Dotan I, Scottoline B, Heuer T, Brown P. J Virol. 1995;69:456–468. - PMC - PubMed
    1. Craigie R, Fujiwara T, Bushman F. Cell. 1990;62:829–837. - PubMed
    1. Jonsson C B, Donzella G A, Roth M J. J Biol Chem. 1993;268:1462–1469. - PubMed

Publication types