. 1997 Feb;109(2):169-80.
doi: 10.1085/jgp.109.2.169.

Dihydropyridine action on voltage-dependent potassium channels expressed in Xenopus oocytes

Affiliations

Dihydropyridine action on voltage-dependent potassium channels expressed in Xenopus oocytes

V Avdonin et al. J Gen Physiol. 1997 Feb.

Abstract

Dihydropyridines (DHPs) are well known for their effects on L-typed voltage-dependent Ca2+ channels, However, these drugs also affect other voltage-dependent ion channels, including Shaker K+ channels. We examined the effects of DHPs on the Shaker K+ channels expressed in Xenopus oocytes. Intracellular applications of DHPs quickly and reversibly induced apparent inactivation in the Shaker K+ mutant channels with disrupted N- and C-type inactivation. We found that DHPs interact with the open state of the channel as evidenced by the decreased mean open time. The DHPs effects are voltage-dependent, becoming more effective with hyperpolarization. A model which involves binding of two DHP molecules to the channel is consistent with the results obtained in our experiments.


Figures

Figure 1
Figure 1
Nifedipine block of K+ currents through ShBΔ6-46 T449V channels. (A) Current traces obtained from the inside-out patch in response to voltage steps from −100 mV to −20 mV, 0 mV, and +50 mV with (bottom) and without (top) nifedipine (50 μM) in the internal solution are shown. (B) Current amplitudes measured at the end of 200-ms pulses with (closed circles) and without (open circles) nifedipine (50 μM) in the internal solution.
Figure 2
Figure 2
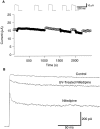
(A) Nifedipine applied externally is less effective in blocking the ionic currents through the ShBΔ6-46 T449V channel. Peak amplitudes of the currents measured using the two-electrode voltage clamp during voltage pulses from −100 mV to +50 mV are plotted (filled circles: data measured during nifedipine (100 μM) application, open circles: wash out of drug). Representative current sweeps recorded at the end of the corresponding segment are shown in inset. (B) Nifedipine, exposed to ultraviolet light, is less effective in blocking the ShBΔ6-46 T449V current. Representative inside-out macro-patch currents in response to pulses from −100 mV to +50 mV. A half of the nifedipine solution (50 μM) was treated with UV light (254 nm 18W for 90 min at 1 cm) and the efficacy of the UV-treated nifedipine was compared with the other half of the nifedipine solution, which did not receive UV treatment.
Figure 3
Figure 3
Block of the ShBΔ6-46 T449V macroscopic currents by different DHPs. Currents were recorded in the inside-out configuration in response to depolarizing voltage steps to 0 mV. Indicated DHPs were applied to the internal side. The concentration was 100 μM for all DHPs.
Figure 4
Figure 4
Concentration dependence of DHP block of the macroscopic currents through the ShBΔ6-46 T449V channels. (A) Current traces obtained in response to voltage steps to +50 mV with the indicated concentrations of nifedipine in the internal solution. (B) Hill plot of the concentration dependence of block of ShBΔ6-46 T449V channel by nimodipine (open circles) and nifedipine (closed circles). Block is given by Idrug/Icontrol. Dashed lines are the least square fits of the data with Hill equation. Both nifedipine and nimodipine fits give a Hill coefficient value of 1.5. (C) Relative reduction of the steady state current measured at the end of a 200-ms voltage pulse to +50 mV by different concentrations of nifedipine. Values on the vertical axis were calculated as 1-Inifedipine/ Icontrol. Data points represent mean ± standard deviation of six experiments. (D) Time constants of the current decline induced by nifedipine block. The currents elicited by 200-ms voltage pulses to +50 mV in the presence of nifedipine at the concentrations indicated were fitted with a sum of two exponentials. (E) Relative reduction of the steady-state current by nimodipine. The data were collected and analyzed as in C. (F) Time constants of the current decline in the presence of nimodipine (averages of four to seven experiments). The data were collected and analyzed as in D. In B–F, smooth curves show least square fits of the data obtained from the simulated currents as described in discussion (thin line, scheme SII, thick line, scheme SV).
Figure 5
Figure 5
Nifedipine decreases the mean open time in ShBΔ6-46 T449V:A463I. (A) Representative openings in the absence (upper traces) and in presence of 100 μM nifedipine (lower traces) in the internal solution. Inside-out configuration at 0 mV. Closed state is indicated by dashed line. The data were filtered at 1.8 kHz. The patch contained one functional channel. (B) Open time histograms with and without 100 μM nifedipine. Data are shown in square root scaling on vertical axis (Sigworth and Sine, 1987). Single exponential fits are shown superimposed. (C) Reciprocals of the mean open times at several concentrations of nifedipine. Each data point represents the mean ± standard deviation of four to six experiments. Solid line shows linear least square fit of first three points.
Figure 6
Figure 6
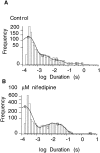
Nifedipine effects on the closed time distribution of ShBΔ6-46 T449V:A463I. Closed time distributions in the absence (A) and in the presence (B) of 100 μM nifedipine. Data are shown in square root scaling on vertical axis. Lines shown represent four exponential fits of the distributions. Under control conditions the time constants (fractional amplitudes) were 0.2 ms (0.871), 2.1 ms (0.097), 16.8 ms (0.029), and 352 ms (0.003). For nifedipine, the three time constants (fractional amplitudes) were 0.2 ms (0.84), 5.7 ms (0.048), and 26 ms (0.109).
Figure 7
Figure 7
Nifedipine block in presence of either N- or C-type inactivation. (A) Internal TEA and N-type inactivation compete. The ShD currents obtained with and without internal TEA (2 mM) are shown at the top and the scaled currents are shown below. The scaled currents show a cross-over. (B) Nifedipine block of the macroscopic currents through ShD channels. (C) Macroscopic currents through the ShBΔ6-46 T449K channels with C-type inactivation (control and 100 μM nifedipine). Scaled currents (lower traces) show that the current in the presence of nifedipine inactivates faster. (D) Time constants of ShBΔ6-46 T449K current decline in control and in the presence of 100 μM nifedipine in internal solution. The current traces were fitted with a sum of two exponentials. Each point represents mean ± standard deviation of 12 experiments (Control) or 8 experiments (Nifedipine). (E) Nifedipine block (50 μM) of the ShBΔ6-46 T449V currents without N- or C-type inactivation recorded with different external K+ concentrations. The currents were elicited by depolarizing pulses to +50 mV.
Figure 8
Figure 8
Voltage dependence of DHP block. The currents were first elicited by voltage pulses to +50 mV followed by voltage steps to −20 to +90 mV in 10 mV increments. (A) The ShBΔ6-46 T449V channels do not show significant relaxation after the voltage change. (B) Slow relaxations of the macroscopic currents through the ShBΔ6-46 T449V channels in presence of 25 μM nimodipine. The currents relaxed to lower values at voltages more negative than +50 mV showing more effective block of nimodipine at these voltages. (C) Same as B in presence of 100 μM nifedipine. (D) Voltage-dependent relaxation of the ShBΔ6-46 T449V:A463I current with 100 μM nifedipine. (E) Voltage dependence of the block for ShBΔ6-46 T449V in the presence of 25 μM (diamonds) and 50 μM (circles) of nifedipine. Relative block was calculated as a ratio of the current value immediately after the voltage change over the current value after relaxation based on the single exponential fit of the current decline. The data sets were fitted with function exp [n e (V − 50) / k T] to obtain number of equivalent charges n. (F ) Concentration dependence of the equivalent charges associated with the voltage dependence of the block obtained as described in E for nifedipine block of the ShBΔ6-46 T449V current (circles), ShBΔ6-46 T449V:A463I current (squares), and nimodipine block of ShBΔ6-46 T449V current (triangles). Solid lines represent the scheme SV predictions of nifedipine (upper line) and nimodipine (lower line) block equivalent charges. The model predictions were calculated using the blocking rate constants obtained from the concentration dependence data shown in Fig. 4. Data points represent mean ± standard deviation of five to eight experiments.
Figure 9
Figure 9
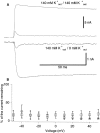
Nifedipine block does not depend on the current flow direction. (A) Macroscopic currents through the ShBΔ6-46 T449V channels (control and 100 μM nifedipine) at +30 mV. Outward currents were obtained with 140 mM K+ out / 140 mM K+ in, and the inward currents with 140 mM K+ out/ no internal K+ (substituted with NMG). (B) Comparison of nifedipine block (100 μM) at various voltages with high K+ (140 mM) inside (circles) and no K+ ions inside (squares). External K+ concentration was 140 mM in both cases. Data points show the fraction of unblocked current at the end of 200-ms voltage pulse to the voltages indicated (mean ± standard deviation of five experiments).
Figure 10
Figure 10
Differential effects of nifedipine on the ShBΔ6-46 T449V and ShBΔ6-46 T449V:A463I channels. (A) Effects of nifedipine (100 μM) on the macroscopic currents recorded at +50 mV from ShBΔ6-46 T449V (top) and ShBΔ6-46 T449V:A463I (bottom). (B) Comparison of the concentration dependence of nifedipine block of the ShBΔ6-46 T449V (circles) and ShBΔ6-46 T449V: A463I (squares) currents. Solid line represents the model prediction of scheme SV for ShBΔ6-46 T449V:A463I. Values of the block constants of nifedipine for ShBΔ6-46 T449V were used in simulation. ShBΔ6-46 T449V:A463I was simulated by stabilizing the open state in scheme SI by 1.3 kcal/mol (see discussion). Each data point represents mean ± standard deviation of six to nine experiments. (C) Scaled tail currents obtained at −100 mV for ShBΔ6-46 T449V and at −120 mV for ShBΔ6-46 T449V:A463I after pulses to +50 mV with 140 mM K+ out. Nifedipine (100 μM) slowed the tail current in ShBΔ6-46 T449V and accelerated in ShBΔ6-46 T449V: A463I.
Scheme I
Scheme I
Scheme II
Scheme II
Scheme III
Scheme III
Scheme IV
Scheme IV
Scheme V
Scheme V

Similar articles

Cited by

References

    1. Baukrowitz T, Yellen G. Use-dependent blockers and exit rate of the last ion from the multi-pore of a K+channel. Science (Wash DC) 1996;271:653–656. - PubMed
    1. Bezanilla F, Perozo E, Stefani E. Gating of Shaker K+channels: II. The components of gating currents and a model of channel activation. Biophys J. 1994;66:1011–1021. - PMC - PubMed
    1. Choi KL, Aldrich RW, Yellen G. Tetraethylammonium blockade distinguishes two inactivation mechanisms in voltage-activated K+channels. Proc Natl Acad Sci USA. 1991;88:5092–5095. - PMC - PubMed
    1. Colquhoun, D., and A.G. Hawkes. 1995. A Q-matrix cookbook: how to write only one program to calculate the single-channel and macroscopic predictions for any kinetic mechanism. In Single-channel recording. Plenum, New York. 589–633.
    1. Demo SD, Yellen G. The inactivation gate of the Shaker K+channel behaves like an open-channel blocker. Neuron. 1991;7:743–753. - PubMed

Publication types