. 1997 Feb;124(3):603-15.
doi: 10.1242/dev.124.3.603.

A single morphogenetic field gives rise to two retina primordia under the influence of the prechordal plate

Affiliations

A single morphogenetic field gives rise to two retina primordia under the influence of the prechordal plate

H Li et al. Development. 1997 Feb.

Abstract

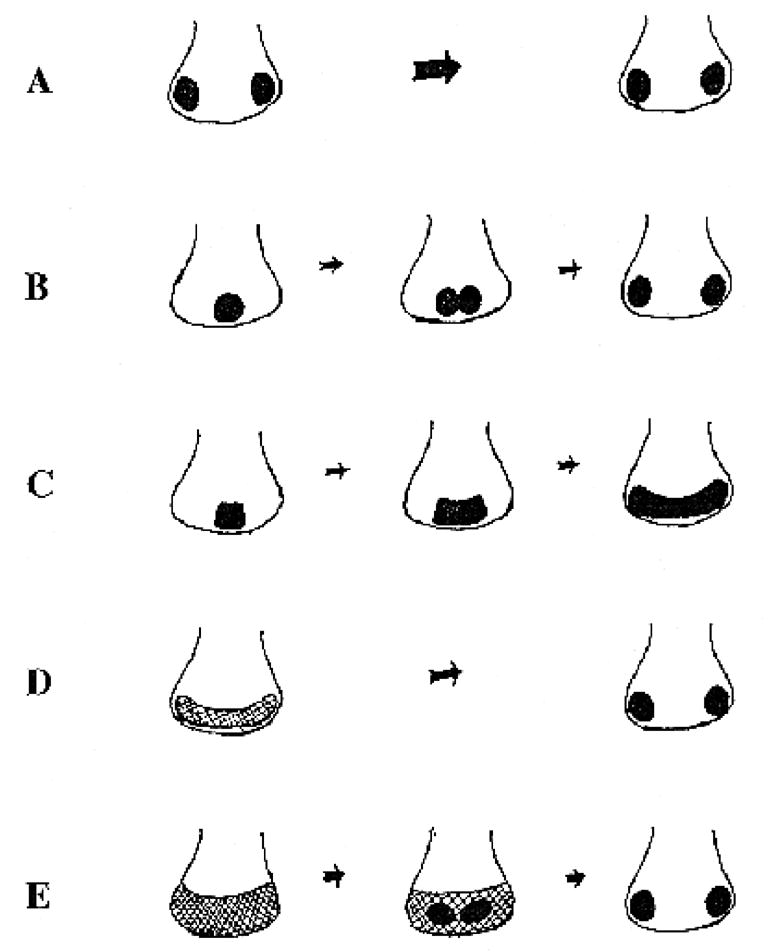
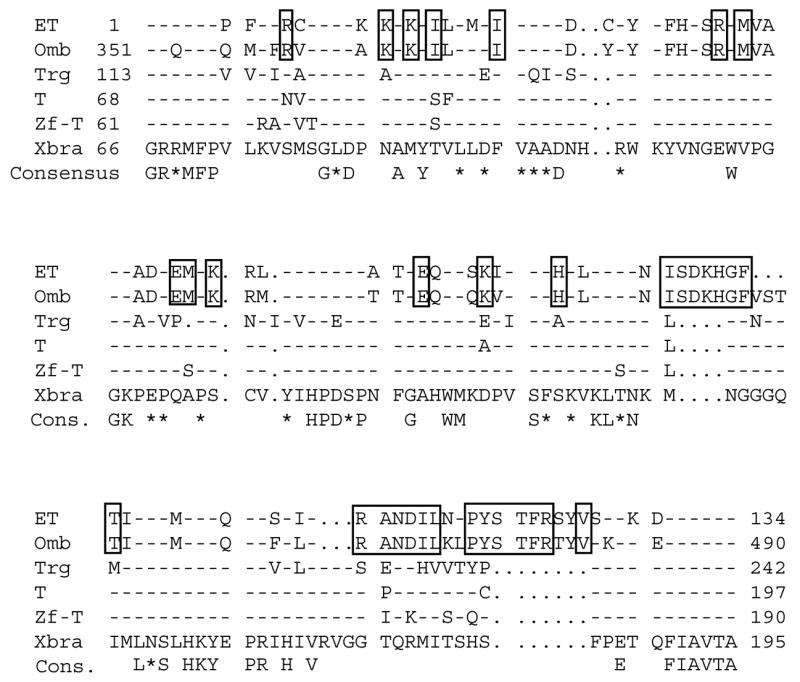
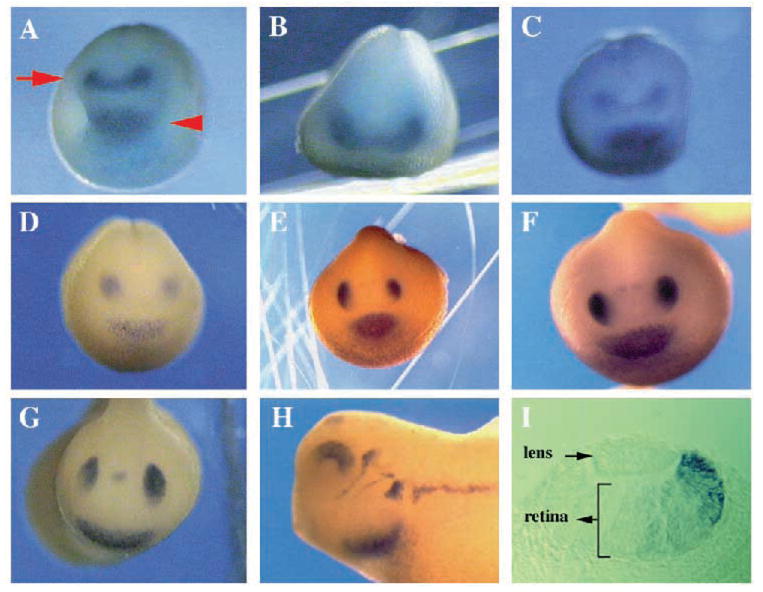
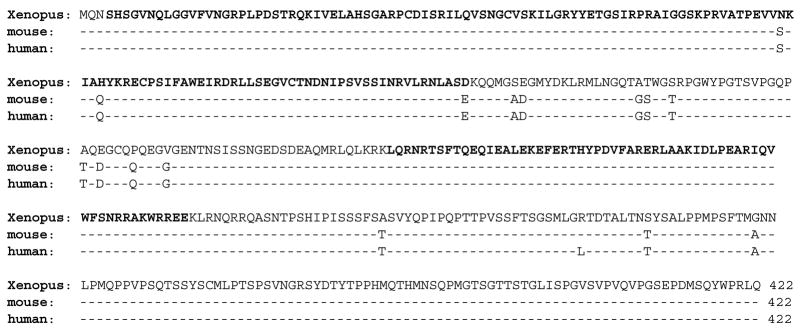
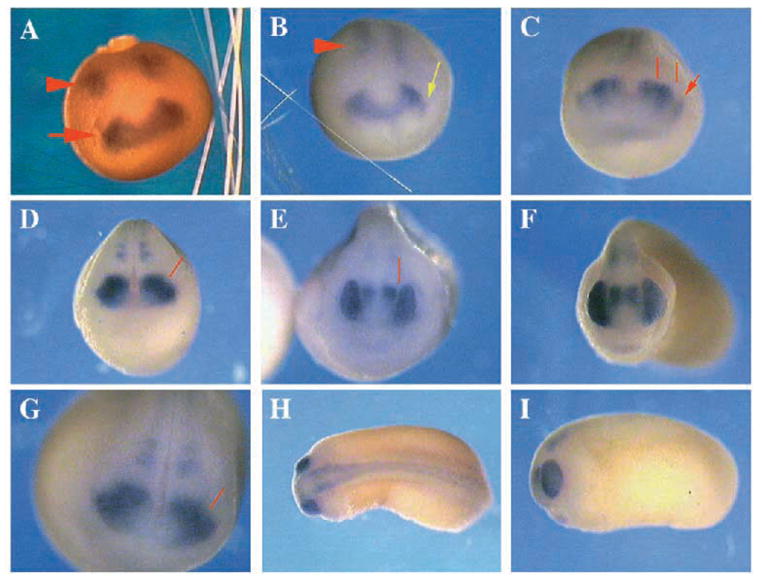
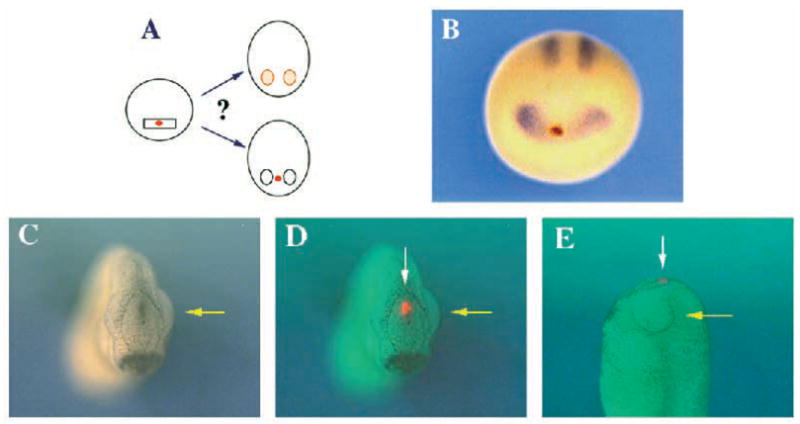
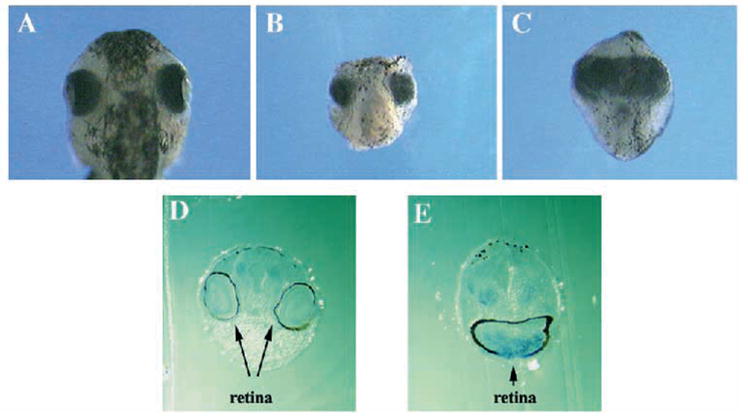
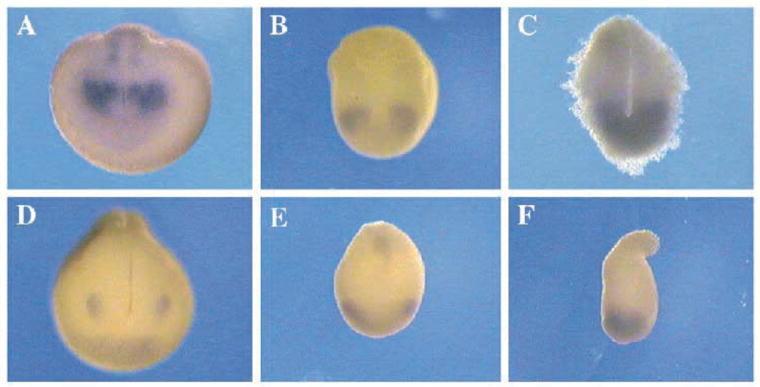
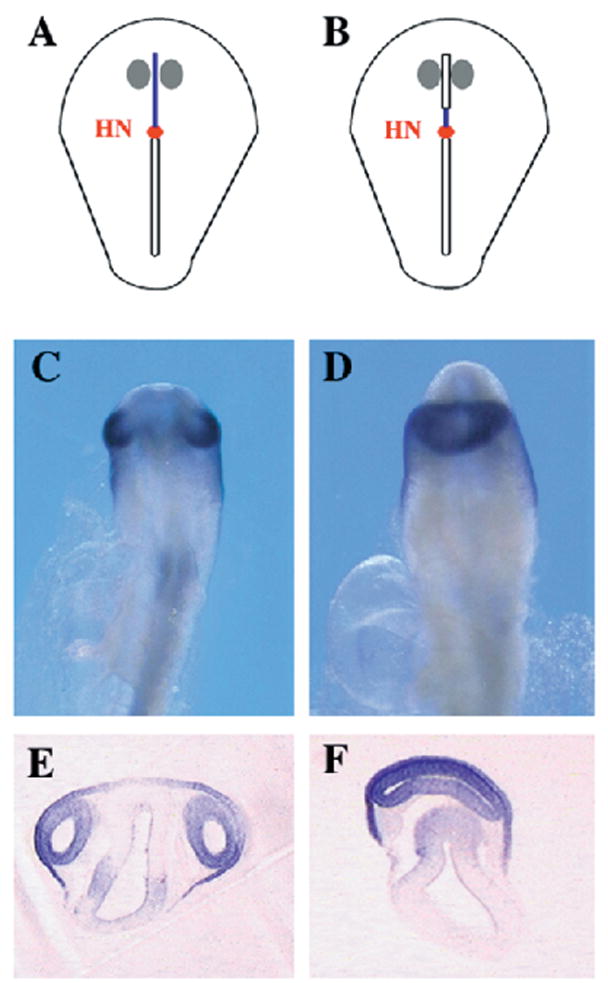
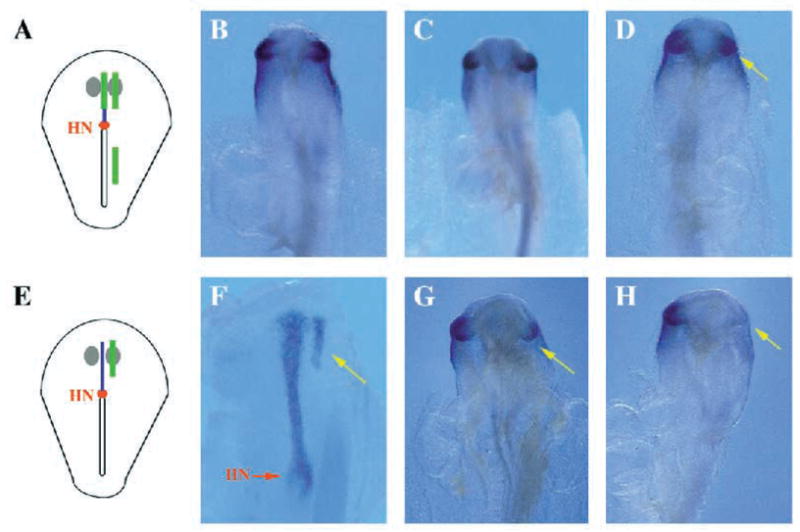
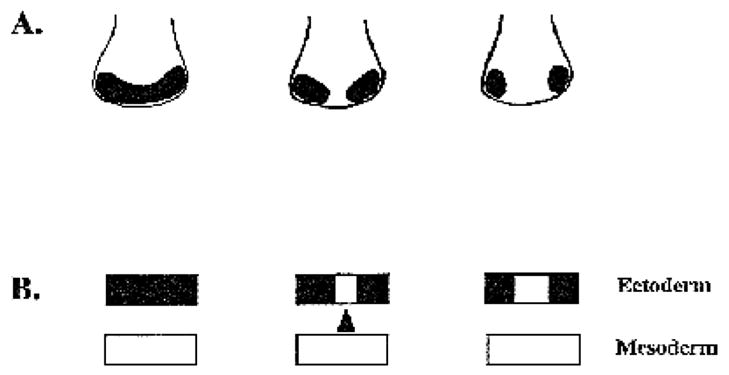
Two bilaterally symmetric eyes arise from the anterior neural plate in vertebrate embryos. An interesting question is whether both eyes share a common developmental origin or they originate separately. We report here that the expression pattern of a new gene ET reveals that there is a single retina field which resolves into two separate primordia, a suggestion supported by the expression pattern of the Xenopus Pax-6 gene. Lineage tracing experiments demonstrate that retina field resolution is not due to migration of cells in the median region to the lateral parts of the field. Removal of the prechordal mesoderm led to formation of a single retina both in chick embryos and in Xenopus explants. Transplantation experiments in chick embryos indicate that the prechordal plate is able to suppress Pax-6 expression. Our results provide direct evidence for the existence of a single retina field, indicate that the retina field is resolved by suppression of retina formation in the median region of the field, and demonstrate that the prechordal plate plays a primary signaling role in retina field resolution.


Figures

Fig. 1
Fig. 1
Models for retina primordium formation in vertebrate embryos. The outline illustrates the boundary of the neural plate and the filled circles represent retina primordia. (A) The two separate retina primordia model. (B) A diagram of Stockard’s model of how a single primordium spreads and separates into two retinae. Some of Stockard’s results were directly contradicted by later studies of Adelmann (1929a,. (C) This is essentially the same as Figs 1, 2 and 4 of LePlat (1919). (D) A schematic representation of Adelmann’s model. It was not determined whether midline cells could migrate laterally. (E) An illustration of the forebrain field model. Eyes are presumably the default fate of this field (Corner, 1966; Boterenbrood, 1970).
Fig. 2
Fig. 2
Alignment of the predicted primary sequence within the T domain of ET with those of other T domain proteins. A dash (-) indicates identity to Xbra. A period (.) indicates a gap. Residues shown in the consensus line are those identical in all known T domains while a star (*) indicates a highly but not absolutely conserved residue. Boxed residues are conserved only between ET and Omb. Omb is the predicted product of the Drosophila gene optomotor blind (Pflugfelderet al., 1992). Trg is that of the Drosophila T related gene involved in hindgut development (Kispert et al., 1994). T, Zf-T (or Ntl) and Xbra are the mouse, zebrafish and Xenopus T proteins respectively (Hermann et al., 1990; Smith et al., 1991; Schulte-Merker et al., 1992). Numbers for the ET sequence indicate positions predicted from the PCR fragment while numbers for known T domain proteins are positions in corresponding full-length proteins.
Fig. 3
Fig. 3
The expression pattern of ET in Xenopus embryos. A to G show anterior views and H is a lateral view. (A) A stage (st.) 12.5 embryo with a band of expression in the anterior neural plate (indicated by the arrow) and one in the primordium of the cement gland (indicated by the arrowhead). Note that the cement gland stays a single structure (A, C–G), whereas the retina band resolves into two primordia in the next few stages. (B) A st. 15 embryo showing retina field expression. The embryo was oriented to maximize visualization of retina expression and the cement gland is thus hardly visible. (C) A st. 16 embryo with ET expression weaker in the median region of the retina field than that in the lateral regions. (D) A st. 18 embryo with two distinct retina primordia. There is no ET expression in the median region. (E) A st. 19 embryo with no midline expression. (F) A st. 20 embryo. Note that weak expression of ET appears in the pineal gland primordium. The intensity of this signal increases in later stages (see G and H). (G) A st. 22 embryo with ET expression in the retina, the cement gland and the pineal gland (the dot between the two eyes). (H) A st. 26 embryo. The staining in the eye is restricted to the dorsal retina, absent from the lens and the ventral retina. Expression in the cephalic ganglia and lateral line organ also appeared. (I) A transverse section of a st. 28 embryo showing ET expression in the dorsal retina. ET is expressed in all layers of the retina, and completely absent from the lens. Dorsal is to the right.
Fig. 4
Fig. 4
Comparison of Pax-6 sequence from Xenopus with those from other species. Alignment of the predicted sequences of full-length Pax-6 proteins from Xenopus, mouse and human. A dash (-) indicates identity to the Xenopus sequence. The paired domain (amino acid residues 3–133) and homeo domain (residues 209–269) are in bold.
Fig. 5
Fig. 5
Distribution of Pax-6 mRNA in Xenopus embryos. A–G show anterior views, H is a dorsal view with the anterior end of the embryo to the left, and I is a lateral view. (A) A st. 12 embryo; note a single band of expression continuous from one side of the embryo to the other in the anterior neural plate (indicated by the red arrow) whereas there are two broad stripes of expression in the primordium of the neural tube (indicated by the red arrowhead). (B) A st. 12.5 embryo. The stripes in the trunk region are thinner and closer to each other than those at st. 12. Note the appearance of lens primordia on each side of the embryo (indicated by the green arrow). (C) A st. 16 embryo. The two red lines demarcate the borders of the retina stripe. The arrow points to a lens primordium. Pax-6 expression has three components: lens primordium, an outer semicircle of the retina field and an inner semicircle of a forebrain structure. The forebrain stripe later resolves into two spots posterior to the eyes shown in D and G, which are the two spots closer to the midline than the eyes in E and F. (D) A st. 18 embryo showing that Pax-6 expression in the median region of the anterior neural plate is turned off. The red line indicates the border between the eye primordium and the forebrain structure. Note also that the lens primordia have moved into the retina primordia to form the eye primordium by this stage (compare D to C). (E) A st. 19 embryo showing distinct Pax 6 expression in the eyes and the forebrain. (F) A stage 26 embryo. (G) Higher magnification of a st. 18 embryo. The line points to the border between the forebrain staining and the eye staining. (H) Dorsal view of a st. 24 embryo showing Pax-6 expression in the neural tube derived from the two broad stripes in the trunk region at st. 12 (the arrowhead in A). (I) A st. 25 embryo. Compare Pax-6 expression in the entire eye to ET expression in only the dorsal retina in Fig. 3H.
Fig. 6
Fig. 6
Fate mapping of midline cells in the retina field of Xenopus embryos. A to D show anterior views. (A) A diagram showing that midline cells in the retina field were labeled by DiI at stages 12 or 12.5 and followed to stage 25 to determine whether the midline cells migrate to the lateral regions. (B) The original location of DiI-labeled cells. This embryo was labeled with DiI at stage 12 and fixed at stage 12.5. DiI was photoconverted to produce the brown spot in the middle of the retina field, which was revealed by in situ hybridization with the Xenopus Pax-6 probe. (C) An image of a stage 25 embryo illuminated by incident light. A yellow arrow points to an eye. (D) A composite of the image shown in C and an image of the same embryo viewed under rhodamine optics to map the location of the fluorescent cells. A yellow arrow points to an eye. This embryo was previously labeled with DiI at stage 12.5. Results were similar with embryos labeled at stage 12. (E) A left side view of another DiI-labeled embryo. Note the absence of DiI labeled cells in the left retina. A white arrow points to DiI-labeled cells. A yellow arrow points to an eye.
Fig. 7
Fig. 7
Effects of removing the prechordal mesoderm on retina formation in Xenopus embryonic explants. (A) A wild-type embryo at st. 35. (B) A st. 35 control explant of the anterior neural plate with the underlying prechordal mesoderm. (C) An anterior neural plate explant without prechordal mesoderm. The explants were isolated at st. 12.5 and cultured until st. 35. (D) A transverse section of a st. 42 control explant after in situ hybridization with a Pax-6 probe. (E) A transverse section of a st. 42 explant without prechordal mesoderm at st. 12.5 and fixed for in situ hybridization with Pax-6 at st. 42. Note the presence of Pax-6 expressing neural retina as well as the retina pigment epithelium.
Fig. 8
Fig. 8
Effects of prechordal mesoderm removal on retina field resolution in Xenopus embryonic explants. (A) A control embryo hybridized with Pax-6 at st. 18. (B) Pax-6 expression in a control anterior neural plate explant with the underlying mesoderm, showing two separate primordia by st. 18. (C) Pax-6 expression in a st. 18 explant of the anterior neural plate without the underlying mesoderm. Note the retina field did not resolve into two separate primordia. (D) A control embryo hybridized with ET at st. 18. (E) ET expression in a st. 18 control explant with the prechordal mesoderm. (F) ET expression in a st. 18 explant without prechordal mesoderm.
Fig. 9
Fig. 9
Effects of prechordal plate removal on retina formation in chick embryos. A–D are ventral views. (A) A diagram of a st. 5 chick embryo showing the location of presumptive retina primordia (indicated by two gray circles) relative to the prechordal plate (marked as a blue line) (Li et al., 1994). The red dot symbolizes Hensen’s node. (B) A diagram of the region removed from the prechordal mesoderm (indicated by a box superimposed on the blue line). (C) A st. 13 chick embryo showing Pax-6 expression in the eyes. (D) Pax-6 expression in a st. 13 chick embryo from which the prechordal plate was removed at st. 5. (E) A transverse section of a st. 13 control chick embryo after in situ hybridization with the Pax-6 probe. Ventral is up. (F) A transverse section of a st. 13 embryo which lacked the prechordal plate. The level of section is similar to that of the control embryo shown in E. Ventral is up.
Fig. 10
Fig. 10
Suppression of Pax-6 expression by the prechordal plate in chick embryos. All panels show ventral views. (A) A diagram of a st. 5 chick donor embryo with the green stripes indicating the origins of the mesodermal tissues used in transplantation. The piece in the midline of the prechordal mesoderm is the prechordal plate and that lateral to the prechordal plate is the lateral prechordal mesoderm. The green stripe in the trunk region shows the origin of the lateral posterior mesodermal transplants. (B) Pax-6 expression in a wild-type st. 13 embryo. Note that Pax-6 expression is equivalent in the two eyes. (C) Pax-6 expression in a st. 13 embryo in which a piece of lateral prechordal mesoderm was inserted into the prechordal mesoderm underlying the left retina primordium at st. 5. The two eyes are equivalent. (D) Pax-6 expression is reduced in a small fraction of embryos receiving a transplanted piece of posterior lateral mesoderm (see also Table 1). This is a typical result from such transplantations with reduced Pax-6 expression in the left eye (indicated by the green arrow). (E) A diagram of the position where a transplant is placed in a host embryo (indicated by the green stripe on the left side of the embryo. (F) Shh expression in a st. 5 embryo with a transplanted piece of prechordal plate on the left side (indicated by a green arrow). A red arrow points to Hensen’s node. (G) Pax-6 expression is clearly reduced in the left eye (indicated by the green arrow) of a st. 13 embryo in which a piece of the prechordal plate was previously transplanted into a slit in the mesoderm underlying the left retina primordium at st. 5. (H) In this embryo, Pax-6 expression was more severely suppressed in the left eye (indicated by the green arrow). Strong Pax-6 suppression was observed only in embryos with prechordal plate transplants (see Table 2 legend).
Fig. 11
Fig. 11
Retina primordium formation in vertebrate embryos. (A) Our model of retina field development. Dorsal views of the anterior neural plate are illustrated here. There is initially a single retina morphogenetic field in the anterior neural plate of vertebrate embryos. Retina formation is suppressed in its median region, resulting in the resolution of the retina field into two retina primordia. (B) The prechordal plate provides a primary signal for retina field resolution. These are transverse section views of the anterior neural plate and its underlying prechordal mesoderm. Experiments reported here demonstrate a role for the prechordal plate while those performed in zebrafish embryos suggest the midline of the neural plate also plays a role (Hatta et al., 1991, 1994; Hatta, 1992; Macdonald et al., 1995; Ekker et al., 1995b).

Similar articles

Cited by

References

    1. Adelmann HB. Experimental studies on the development of the eye. I The effect of the removal of median and lateral areas of the anterior end of the urodelan neural plate on the development of the eyes (Triton teniatus and Amblystoma punctatum) J Exp Zool. 1929a;54:249–290.
    1. Adelmann HB. Experimental studies on the development of the eye. II The eye-forming potencies of the median portions of the urodelan neural plate (Triton teniatus and Amblystoma punctatum) J Exp Zool. 1929b;54:291–317.
    1. Adelmann HB. Experimental studies on the development of the eye. III The effect of the substrate (‘unterlagerung’) on the heterotopic development of median and lateral strips of the anterior end of the neural plate of Amblystoma. J Exp Zool. 1930;57:223–281.
    1. Adelmann HB. A study of cyclopia in Amblystoma punctatum, with special reference to the mesoderm. J Exp Zool. 1934;67:217–281.
    1. Adelmann HB. The problem of cyclopia. Pt I. Quar Rev Biol. 1936a;11:161–182.