. 1997 Mar 15;17(6):2079-87.
doi: 10.1523/JNEUROSCI.17-06-02079.1997.

Local homogeneity of cell cycle length in developing mouse cortex

Collaborators, Affiliations

Local homogeneity of cell cycle length in developing mouse cortex

L Cai et al. J Neurosci. .

Abstract

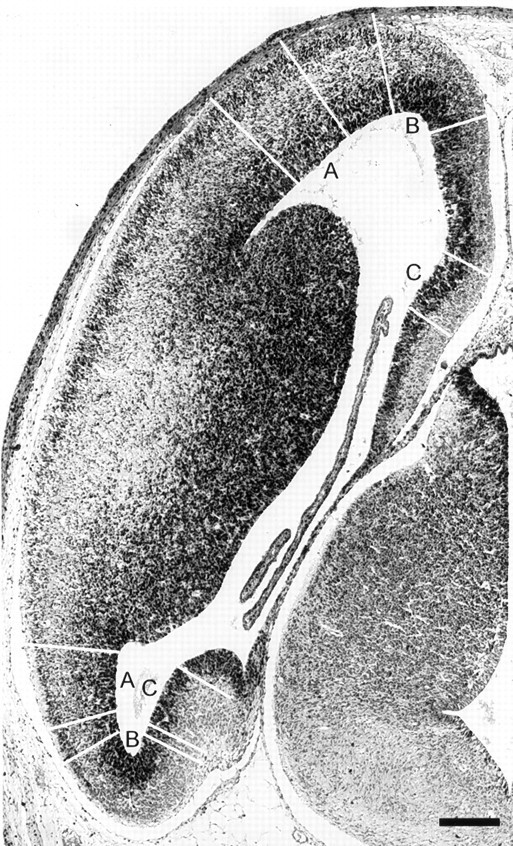
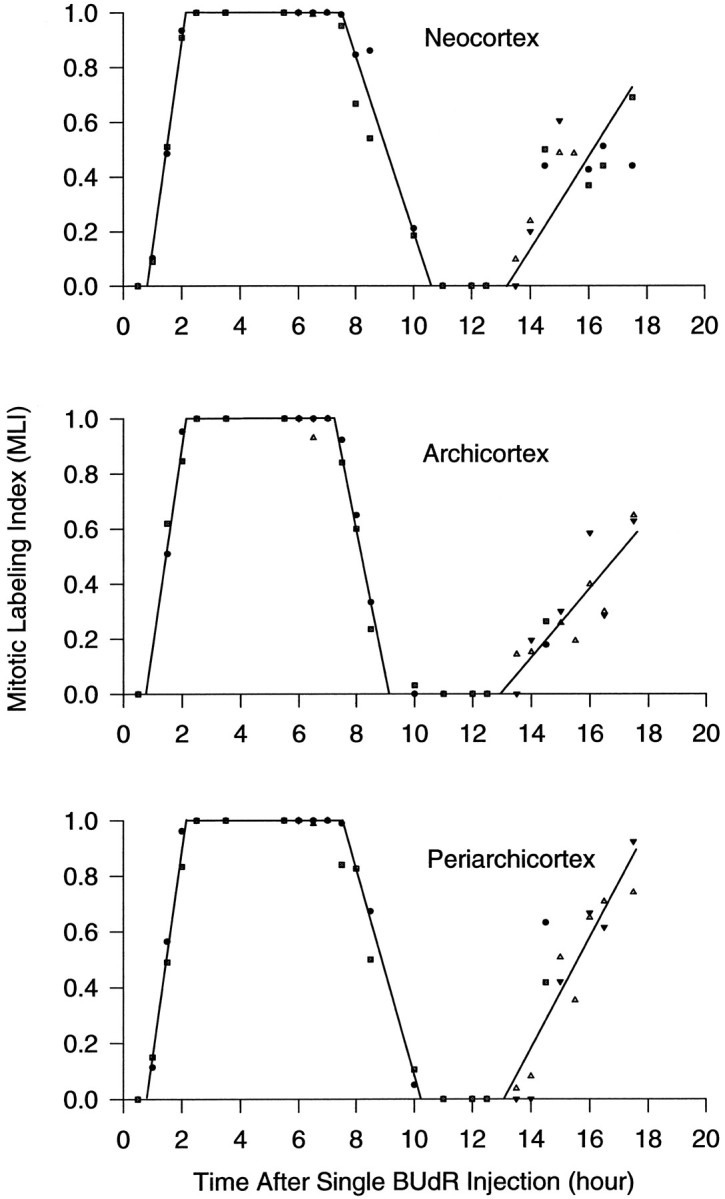
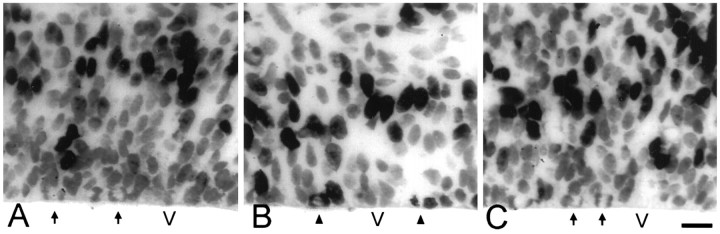
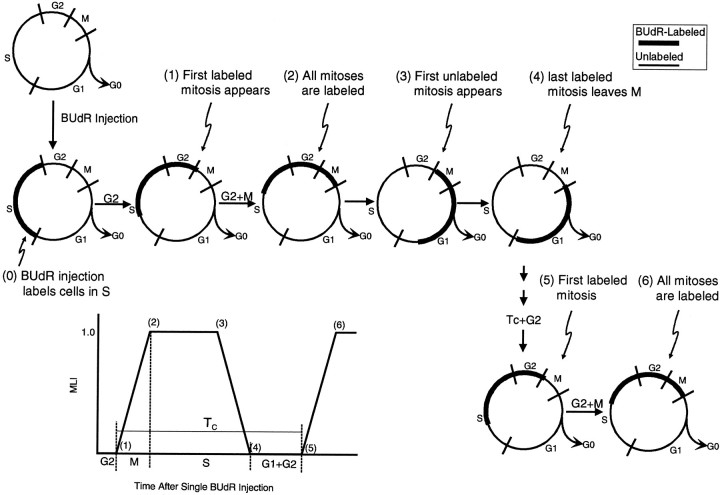
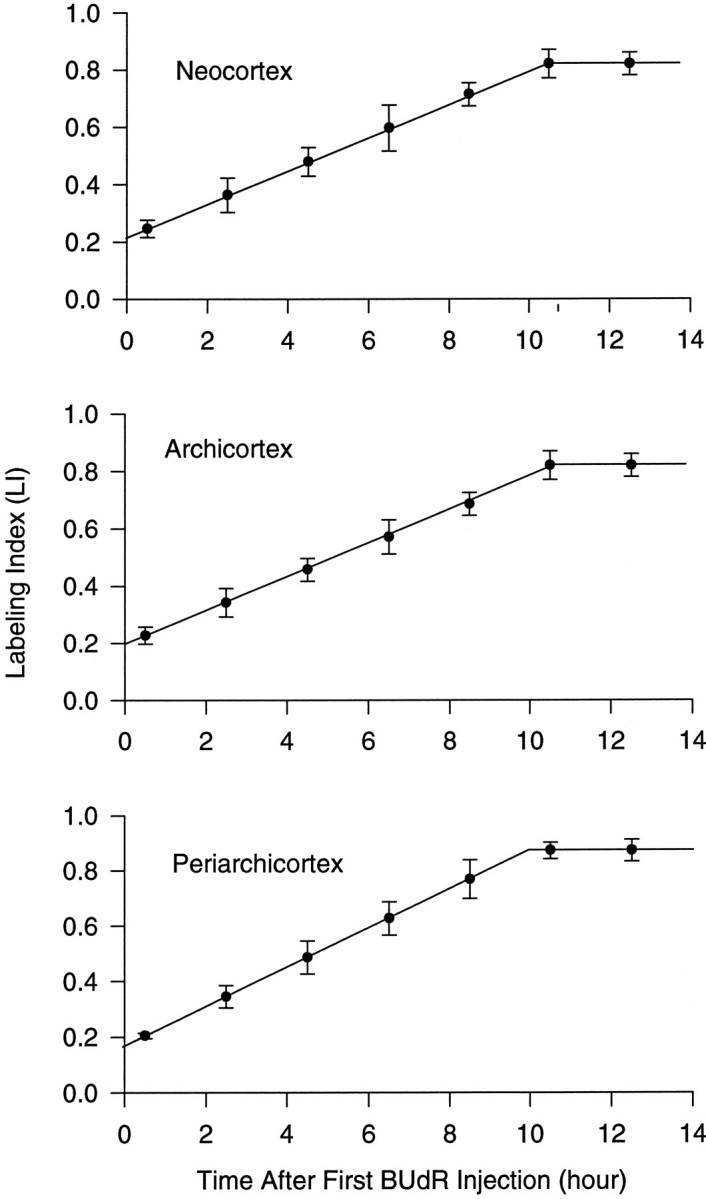
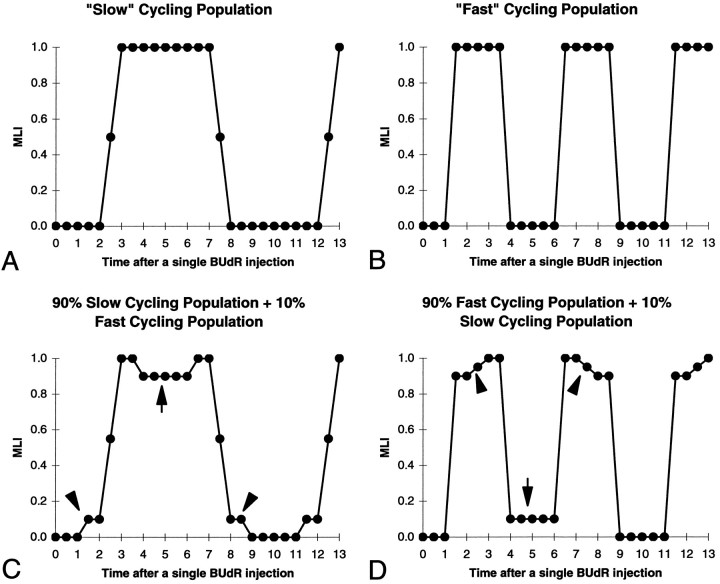
We have measured the amount of variation in the length of the cell cycle for cells in the pseudostratified ventricular epithelium (PVE) of the developing cortex of mice on embryonic day 14. Our measurements were made in three cortical regions (i.e., the neocortex, archicortex, and periarchicortex) using three different methods: the cumulative labeling method (CLM), the percent labeled mitoses (PLM) method, and a comparison of the time needed for the PLM to ascend from 0 to 100% with the time needed for the PLM to descend from 100 to 0%. These 3 different techniques provide different perspectives on the cytokinetic parameters. Theoretically, CLM gives an estimate for a maximum value of the total length of the cell cycle (TC), whereas PLM gives an estimate of a minimum value of TC. The difference between these two estimates indicates that the range for TC is +/-1% of the mean TC for periarchicortex, +/-7% for neocortex, and +/-8% for archicortex. This was confirmed by a lengthening of the PLM descent time in comparison with its ascent time. The sharpness of the transitions and the flatness of the plateau of the PLM curves indicate that 99% of the proliferating cells are within this narrow estimated range for TC; hence, only approximately 1% deviate outside of a relatively restricted range from the average TC of the population. In the context of the possible existence within the cortical PVE of two populations with markedly dissimilar cell cycle kinetics from the mean, one such population must comprise approximately 99% of the total population, and the other, if it exists, is only approximately 1% of the total. This seems to be true for all three cortical regions. The narrow range of TC indicates a homogeneity in the cell cycle length for proliferating cells in three different cortical regions, despite the fact that progenitor cells of different lineages may be present. It further predicts the existence of almost synchronous interkinetic nuclear movements of the proliferating cells in the ventricular zone during early development of the cerebral cortex.


Figures

Fig. 1.
Fig. 1.
A section through a cerebral hemisphere of the E14 mouse to illustrate the location of the cortical subdivisions analyzed. The three areas can be distinguished by their unique structure and their location and are indicated by white lines spanning the pallium and by letters in the lateral ventricles. The neocortical region analyzed was in the lateral wall (A); the archicortical region analyzed was in the hippocampal anlage in the medial wall (C); and the periarchicortical region analyzed occupied the curve near the rostral or caudal tip of the brain (B). On this approximately horizontal section, the areas analyzed are sectioned twice, once in the rostral portion of the cerebrum (top) and once in the caudal portion of the cerebrum (bottom). The areas selected for analysis always included all three cortical areas on a single section and subtended 200 μm along the ventricular surface. Scale bar, 200 μm.
Fig. 5.
Fig. 5.
Graphs of the MLI of the developing cortex of the E14 mouse after a single injection of BUdR. MLI was calculated for each section and averaged for each fetus and then averaged for each litter; data for each litter (2–4 fetuses) were then plotted as a function of time after the single BUdR injection. The length of each phase of the cell cycle was determined from this plot as shown. Data points in the three different shapes (i.e., square,circle, triangle, and inverted triangle) at single time points represent data from different litters belonging to different experimental groups (see Materials and Methods). Note that in some cases the plotted data points from the different experimental groups fall exactly on top of one another and, hence, obscure the existence of the different shapes; this most frequently occurs for data across the 100% plateau. The location and length of the rise and fall phases were obtained using a linear least-squares fit to the data points that are clearly on the rising or falling phase, respectively. The values of all cell cycle parameters were derived from these data according to the methods illustrated in the graph in the bottom left corner in Figure 3 and are summarized in Table 1. A, Neocortex; B, archicortex; C, periarchicortex.
Fig. 2.
Fig. 2.
Photomicrographs of 4-μm-thick horizontal sections through the neocortical PVE in the lateral region of the cerebral wall of E14 mice after in utero exposure to a single BUdR injection. A, Animal killed 1.0 hr after injection, before the labeled cohort of cells has entered M phase.B, Animal killed 5.5 hr after injection, well after the labeled cohort entered M phase. C, Animal killed 10.5 hr after injection, when the labeled cohort had exited M phase. Unlabeled (arrows) and labeled (arrowheads) mitotic figures are located along the margin of the lateral ventricle. The tissue was processed for BUdR immunohistochemistry and lightly counterstained with basic fuchsin. V, Lateral ventricle. Scale bar, 20 μm.
Fig. 3.
Fig. 3.
Experimental design for the PLM method. The progression of cells through the cell cycle is depicted in both parts of the figures. The numbers 0–6 correspond in the two graphs. 0, At the initiation of the experiment, a single injection of BUdR labels a cohort of cells that are in S phase at the time of the injection (heavy line). 1, Labeled cohort progresses through the cell cycle, and soon after the lead cell enters M phase the first labeled mitotic figure appears. The time between injection of the BUdR and the appearance of the first labeled mitotic figure is approximately the length of G2.2, When the lead labeled cell reaches the end of M phase, all metaphase cells will be labeled, at which time the MLI will reach 100%. The time of injection to the time when MLI reaches 100% is approximately equal to the duration of G2 + M.3, As the cohort continues to progress through the cell cycle, the MLI will remain at 100% until soon after the first unlabeled cell has entered M. At this time, unlabeled metaphase cells will begin to appear. 4, When the trailing cell of the labeled cohort has exited M, MLI once again is 0%. 5, When the labeled lead cell reenters M phase, a new rise time of MLI begins. The interval between corresponding points in two successive cell cycles (e.g., 1 and 5) provides a measure of TC. All other cytokinetic parameters (i.e., TS, TG1, TM, and TG2) can be obtained by calculation.
Fig. 4.
Fig. 4.
Graphs of LI of the developing cortex of the E14 mouse using the BUdR CLM. LI increases linearly until all proliferating cells (GF) have been labeled; labeling of GF occurs at a time equal to TC − TS. The labeling index at they-intercept corresponds to TS/TC × GF. They-intercept and inflection of the curve are extrapolated from a least-squares fit slope from all data points (for a complete discussion, see Nowakowski et al., 1989). The values of all cell cycle parameters derived from these data are summarized in Table 1.A, Neocortex; B, archicortex;C, periarchicortex.
Fig. 6.
Fig. 6.
Predicted graphs of the MLI for hypothetical proliferative populations. A, B, Pure homogeneous populations of slow (A) and fast (B) cycling cells. TC of the slow cycling population is 10 hr, and TC of the fast cycling population is 5 hr. Note that both the 0 and the 100% “plateau” phases in both pure populations are flat. C, D, Graphs of MLIs in heterogenous populations containing 90% slow with 10% fast cycling cells (C ) and 90% fast and 10% slow cycling cells (D). Transient deviations occur during both the 0 and the 100% plateau phases (arrowsand arrowheads), as well as at the beginnings and ends of the rising and falling phases.

References

    1. Angevine JB, Jr, Sidman RL. Autoradiographic study of cell migration during histogenesis of cerebral cortex in the mouse. Nature. 1961;192:766–768. - PubMed
    1. Cai L, Hayes NL, Nowakowski RS. Comparison of the cumulative S-phase labeling method and the percent labeled mitoses method in the developing cerebral cortex. Soc Neurosci Abstr. 1993;19:30.
    1. Cai L, Hayes NL, Nowakowski RS. Synchrony of clonal cell proliferation and contiguity of clonally related cells: production of mosaicism in the ventricular zone of developing mouse neocortex. J Neurosci. 1997;17:2088–2100. - PMC - PubMed
    1. Caviness VS., Jr Neocortical histogenesis in normal and reeler mice: a developmental study based upon [3H]thymidine autoradiography. Dev Brain Res. 1982;4:293–302. - PubMed
    1. Caviness VS, Jr, Sidman RL. Time of origin of corresponding cell classes in the cerebral cortex of normal and reeler mutant mice: an autoradiographic analysis. J Comp Neurol. 1973;148:141–151. - PubMed

Publication types

LinkOut - more resources