. 1997 Mar 15;17(6):2212-26.
doi: 10.1523/JNEUROSCI.17-06-02212.1997.

Acetylcholine, outer hair cell electromotility, and the cochlear amplifier

Affiliations

Acetylcholine, outer hair cell electromotility, and the cochlear amplifier

P Dallos et al. J Neurosci. .

Abstract

The dominant efferent innervation of the cochlea terminates on outer hair cells (OHCs), with acetylcholine (ACh) being its principal neurotransmitter. OHCs respond with a somatic shape change to alterations in their membrane potential, and this electromotile response is believed to provide mechanical feedback to the basilar membrane. We examine the effects of ACh on electromotile responses in isolated OHCs and attempt to deduce the mechanism of ACh action. Axial electromotile amplitude and cell compliance increase in the presence of the ligand. This response occurs with a significantly greater latency than membrane current and potential changes attributable to ACh and is contemporaneous with Ca2+ release from intracellular stores. It is likely that increased axial compliance largely accounts for the increase in motility. The mechanical responses are probably related to a recently demonstrated slow efferent effect. The implications of the present findings related to commonly assumed efferent behavior in vivo are considered.


Figures

Fig. 1.
Fig. 1.
A, Video image showing the experimental setup for microchamber measurements. The OHC is inserted into the microchamber with its synaptic pole outside. Fractional cell length outside the chamber is designated with q. The diameter of the cell and its cuticular plate are imaged via rectangular slits on photodiodes. The photocurrents are proportional to diameter and length changes, respectively. Command voltage (Vc) is delivered between electrolytes inside and surrounding the microchamber. ACh is delivered to the synaptic pole of the cell. B, Video image showing the experimental setup for measuring electromotility with the whole-cell patch technique. Cell length changes are measured as inA, and ACh is delivered to the synaptic pole.C, Video image showing the experimental setup for stiffness measurements and for constrained electromotility measurement. A piezo-driven glass fiber is brought up against the synaptic pole of the cell. The cell is inserted into a microchamber with ciliary pole inside and q = 0.8–0.9. ACh is delivered to the synaptic pole, and its displacement is measured as inA.
Fig. 2.
Fig. 2.
A, Example of membrane potential from a cell clamped to zero membrane current during the delivery of an ACh puff. B, Example of membrane current waveforms from an isolated OHC (cell length L = 60 μm) under voltage clamp. The cell was held at −70 mV, and membrane potential was stepped from −140 mV to +53 mV in 13 mV increments. Eighty-five percent series resistance compensation was applied.Left, Reference responses; middle, after application of 50 μm ACh. Right graph, Steady-state I–V curves derived from the waveforms.
Fig. 3.
Fig. 3.
Motility data for three cells stimulated in the whole-cell voltage-clamp mode. Holding potential is at −70 mV, and membrane voltage is stepped between −140 mV and +85 mV in 15 mV step increments (top traces). Cell motility is measured as in Figure 1B. Left column, Pre-Ach control responses; center column, after ACh application. Cell contraction is plotted down. Right column, Steady-state δL-V plots for the control and ACh conditions. Abscissa, membrane potential; ordinate, motile response (nm). Cell lengths: 51, 53, and 45 μm.
Fig. 4.
Fig. 4.
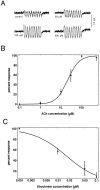
A, Representative motile response waveforms from one cell obtained when different ACh concentrations are applied to the synaptic pole of the cell. Electrical driving signal is a 10 Hz sinusoid. B, Normalized dose–response curve obtained from eight OHCs. Data points are mean values; error bars represent 2 SD. The smooth curve is the Hill equation with half-activating concentration of 21.3 μm and slope of 1.6. C, Normalized antagonizing effect of strychnine on increased motility evoked by 100 μm ACh in six hair cells. Data points are mean values; error bars represent 2 SD. Fifty percent reduction is seen at 0.015 μm.
Fig. 5.
Fig. 5.
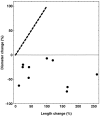
Simultaneously measured change in cell length and diameter for 10 OHCs. Reference condition is pre-ACh; experimental condition is after application of 30 μm ACh.Dotted line represents theoretical condition of equal percentage of length and diameter change. Experimental arrangement is as in Figure 1A.
Fig. 6.
Fig. 6.
Example of square-pulse electrical stimulation (top trace: stimulus waveform,Vc = ±50 mV) of an isolated OHC in the microchamber, as in Figure 1A. Cell exclusion,q = 0.2; here the displacement of the included, ciliated pole is measured. Total pulse duration: 60 msec. Cell contraction is plotted down. Second trace, Control response in normal medium. Third trace, Response in the presence of 30 μm ACh in Ca2+-free medium (containing 5 mm EGTA). Bottom trace, Response in normal medium in the presence of 30 μmACh.
Fig. 7.
Fig. 7.
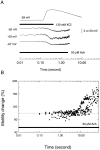
A, Results of whole-cell patch recordings. Top trace is calibration of the time course of ligand delivery. Depolarization of cell on pressure ejection of 130 mm KCl from the delivery pipette (20 mV vertical scale bar). The next three traces show time course of membrane hyperpolarization from the indicated zero current potential (membrane potential) for three OHCs in response to 50 μm ACh (2 mV vertical scale bar). B, Results of microchamber experiments. Continuous electrical stimulation of the cell with 100 Hz sinusoidal voltage elicited sinusoidal electromotile response. Peak-to-peak amplitude of this response was measured in consecutive 100 msec intervals and plotted as individual data points for three cells.Dotted horizontal line is the average pre-ACh motility amplitude. ACh (50 μm) delivery starts at time 0. Note logarithmic time scales.
Fig. 8.
Fig. 8.
Five examples of decreased fluorescence on gradual application of 150 μm ACh to the bath, starting at time 0. Fluorescence values are normalized to that measured at time 0.Heavy data points represent mean control values (no ACh) for seven cells to indicate the background decline of fluorescence, presumably attributable to photobleaching. Error bars represent 2 SD. Note that pre-ACh experimental and control results are similar.
Fig. 9.
Fig. 9.
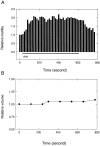
A, Motile response measured in the microchamber over time before and during the delivery of 50 μm ACh. Bars represent response magnitudes averaged over 16 sec periods with 300 msec long, 50 Hz sinusoidal electrical stimuli having a repetition rate of 3/sec. Cell length is 61 μm, q = 0.8. B, Simultaneous volume change measured off-line from the videotaped image of the cell.
Fig. 10.
Fig. 10.
Experiment as in Figure 1C.Top trace is displacement of free fiber driven by a piezoelectric actuator. Second trace, Electromotile response of the cell without the fiber loading it. Third trace, As above but with the fiber attached to the cell.Fourth trace, Loaded fiber motion driven by the piezoelectric actuator. Left column gives control conditions; right column provides corresponding data after application of 50 μm ACh. Cell length is 60 μm.
Fig. 11.
Fig. 11.
A, Mechanical equivalent circuit of the nonpartitioned cell. B, Mechanical equivalent circuit of cell partitioned in the microchamber. Cell membrane is attached at the orifice of the microchamber. Symbols: Φa, Displacement of elementary motor in the axial direction; ka, elementary stiffness;da, elementary damping;Ka, global stiffness;Da, global damping;Na and Nc, linear packing density of motors in axial and circumferential directions;L and r = cell length and radius.

References

    1. Allen JB. Modeling the noise damaged cochlea. In: Dallos P, Geisler CD, Matthews JW, Ruggero MA, Steele CR, editors. The mechanics and biophysics of hearing. Springer; Berlin: 1990. pp. 324–332.
    1. Art JJ, Fettiplace R, Fuchs PA. Synaptic hyperpolarization and inhibition of turtle cochlear hair cells. J Physiol (Lond) 1984;356:525–550. - PMC - PubMed
    1. Art JJ, Crawford AC, Fettiplace R, Fuchs PA. Efferent modulation of hair cell tuning in the cochlea of the turtle. J Physiol (Lond) 1985;360:397–421. - PMC - PubMed
    1. Ashmore JF. A fast motile response in guinea pig outer hair cells: the cellular basis of the cochlear amplifier. J Physiol (Lond) 1987;388:323–347. - PMC - PubMed
    1. Ashmore JF. Transducer motor coupling in cochlear outer hair cells. In: Wilson JP, Kemp DT, editors. Mechanics of hearing. Plenum; New York: 1989. pp. 107–113.

Publication types

LinkOut - more resources