. 1997 Feb 24;136(4):833-44.
doi: 10.1083/jcb.136.4.833.

Mitochondrial participation in the intracellular Ca2+ network

Affiliations

Mitochondrial participation in the intracellular Ca2+ network

D F Babcock et al. J Cell Biol. .

Abstract

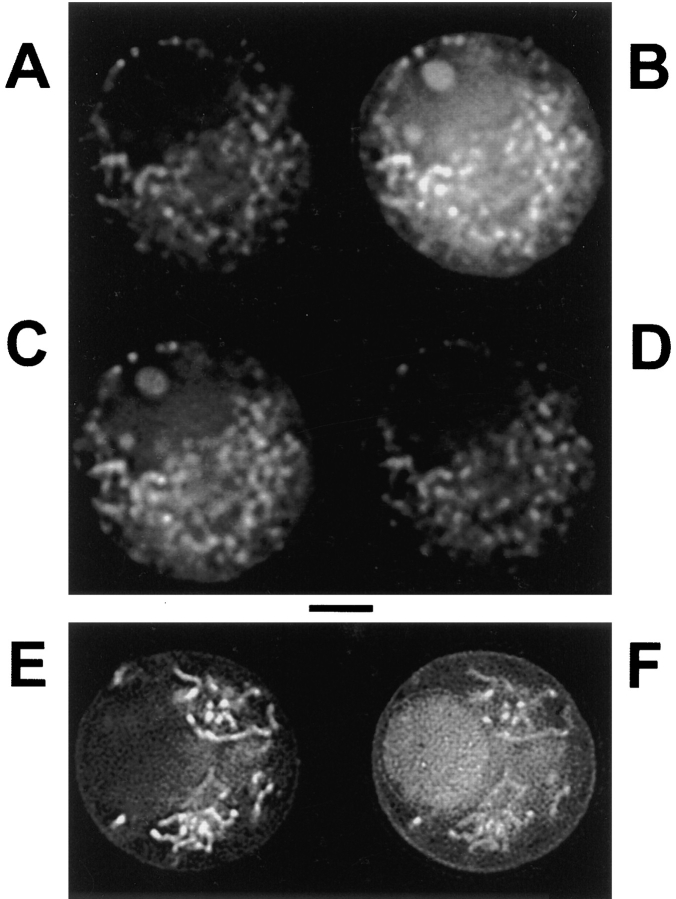
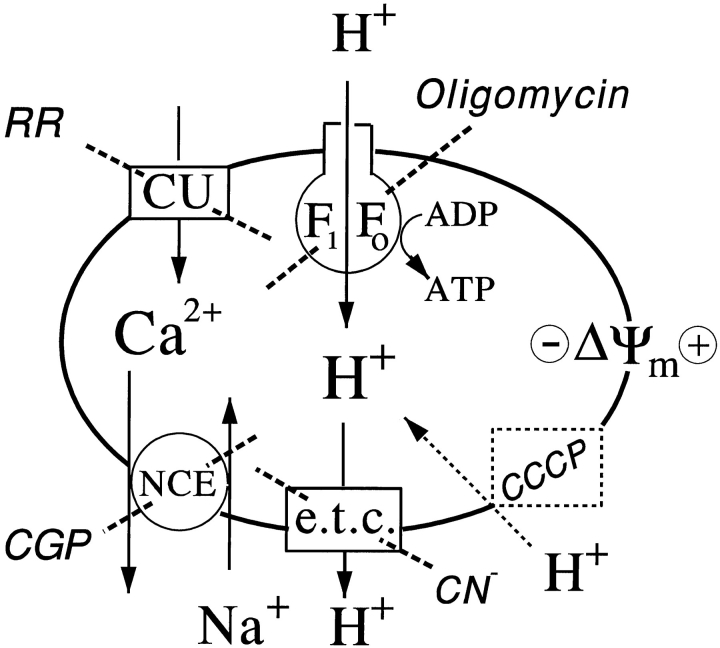
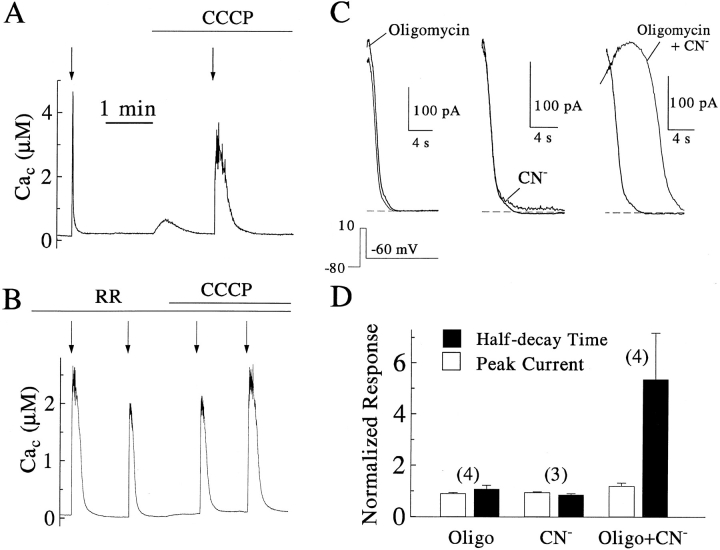
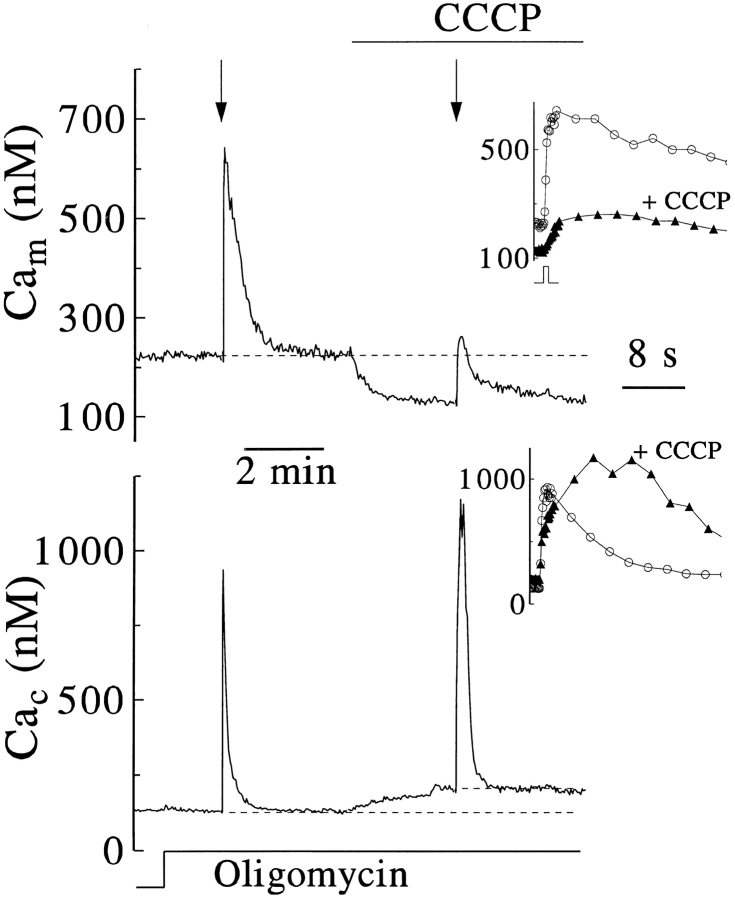
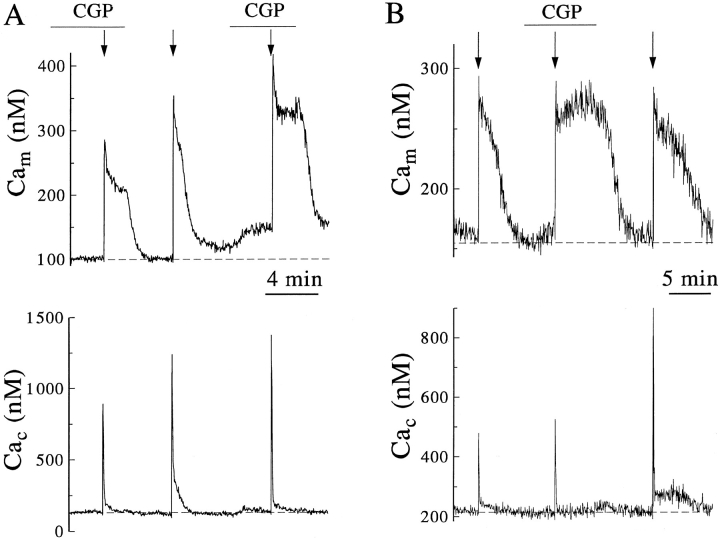
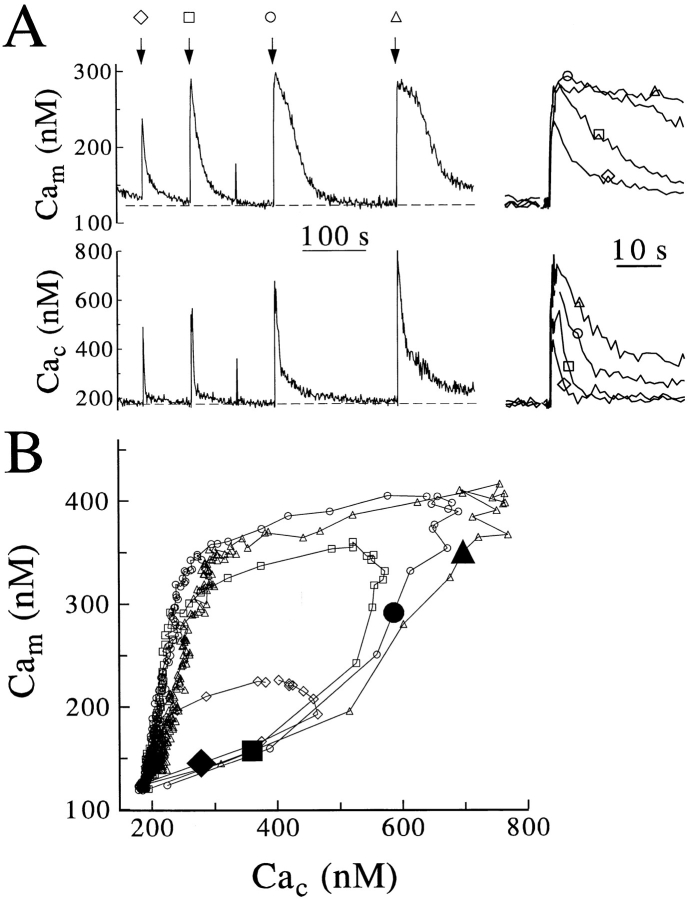
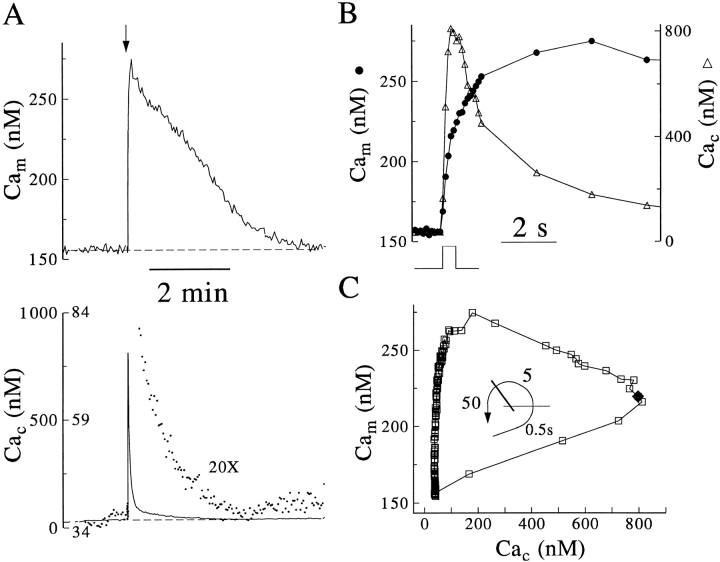
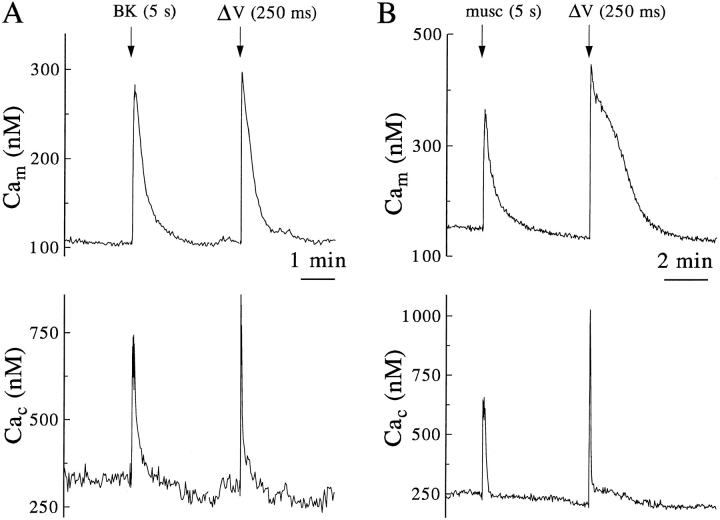
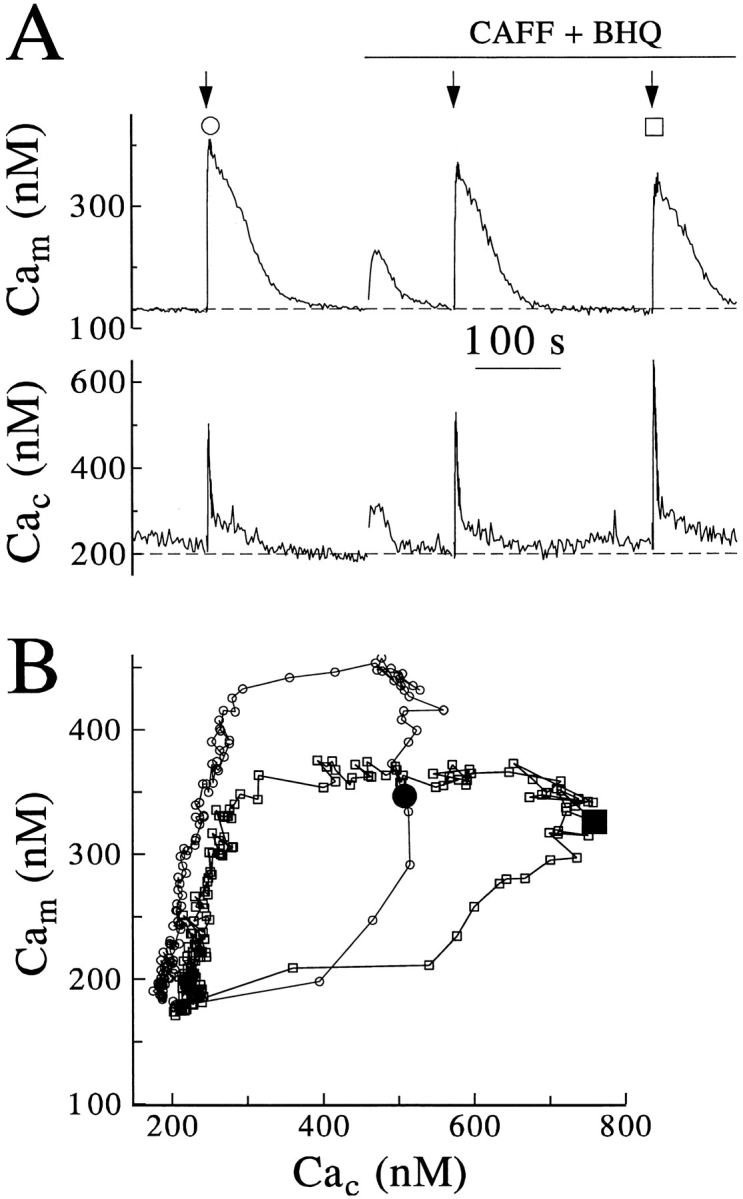
Calcium can activate mitochondrial metabolism, and the possibility that mitochondrial Ca2+ uptake and extrusion modulate free cytosolic [Ca2+] (Cac) now has renewed interest. We use whole-cell and perforated patch clamp methods together with rapid local perfusion to introduce probes and inhibitors to rat chromaffin cells, to evoke Ca2+ entry, and to monitor Ca2+-activated currents that report near-surface [Ca2+]. We show that rapid recovery from elevations of Cac requires both the mitochondrial Ca2+ uniporter and the mitochondrial energization that drives Ca2+ uptake through it. Applying imaging and single-cell photometric methods, we find that the probe rhod-2 selectively localizes to mitochondria and uses its responses to quantify mitochondrial free [Ca2+] (Cam). The indicated resting Cam of 100-200 nM is similar to the resting Cac reported by the probes indo-1 and Calcium Green, or its dextran conjugate in the cytoplasm. Simultaneous monitoring of Cam and Cac at high temporal resolution shows that, although Cam increases less than Cac, mitochondrial sequestration of Ca2+ is fast and has high capacity. We find that mitochondrial Ca2+ uptake limits the rise and underlies the rapid decay of Cac excursions produced by Ca2+ entry or by mobilization of reticular stores. We also find that subsequent export of Ca2+ from mitochondria, seen as declining Cam, prolongs complete Cac recovery and that suppressing export of Ca2+, by inhibition of the mitochondrial Na+/ Ca2+ exchanger, reversibly hastens final recovery of Cac. We conclude that mitochondria are active participants in cellular Ca2+ signaling, whose unique role is determined by their ability to rapidly accumulate and then release large quantities of Ca2+.


Figures

Figure 1
Figure 1
Rhod-2 images of chromaffin cell responses to depolarization and coimages of rhod-2 with Calcium Green. (A–D) Fluorescence deconvolution images of a single cell after loading with AM ester of rhod-2. Images were collected before, during, ∼4 s after, and ∼1 min after a 10-s, fast local perfusion with a depolarizing (70 mM KCl) medium. (E–F) After coloading with AM esters of rhod-2 and Calcium Green, images were collected from a central plane of a single cell not subjected to stimulus, using excitation and emission filters for rhod-2 in E and then for Calcium Green in F. Scale bar represents 4 μm.
Figure 2
Figure 2
Pathways of Ca2+ and H+ transport in the inner mitochondrial membrane and diagnostic inhibitors. Abbreviations: CU, Ca2+ uniporter inhibited by ruthenium red, RR; F1F0, ATP synthase inhibited by oligomycin; NCE, Na+-Ca2+ exchanger inhibited by CGP-37157, CGP; e.t.c., electron transport chain inhibited by cyanide; CCCP, a protonophore that collapses the mitochondrial membrane potential, Δψm.
Figure 3
Figure 3
Prolongation of Ca2+ clearance by blockade of mitochondrial energization or of the mitochondrial uniporter. (A–B) Time course of cytoplasmic [Ca2+] monitored with indo-1 (100 μM) introduced into the cytosol by inclusion in the pipette solution alone (A) or, in a different cell, together with 2 μM RR (B). Beginning 3–5 min after the wholecell patch-clamp configuration was established, dual emission fluorescence signals were recorded. One or two 500–600-ms depolarizing pulses were applied (arrows) while each cell was perfused with control medium alone. Another one or two pulses were applied after 2 μM CCCP was included in the perfusion medium. (C– D) Effect of mitochondrial inhibitors on clearance of submembrane Cac as measured by the decay (tail) of a Ca2+-activated K+ current. Tail currents were recorded in perforated-patch configuration in response to 1-s depolarizations to 0 mV applied every 2 min (Park, 1996). After 9.5 min, the perfusion medium was supplemented with 3 μM oligomycin or 5 mM NaCN and at 11.5 min, with both. (D) Peak amplitude and half-decay times of currents observed after treatment were normalized to those obtained in the preceding control stimulus applied to the same cell. The numbers of cells examined are shown in parentheses.
Figure 4
Figure 4
Reciprocal actions of CCCP on mitochondrial and cytosolic Ca2+. Fluorescence signals from rhod-2 and Calcium Green, coloaded as AM esters in a preliminary incubation, were recorded simultaneously from a single cell, beginning 3–5 min after the perforated patch clamp configuration was established. The perfusion medium then was supplemented with 10 mM Ca2+ and 3 μM oligomycin and then with 2 μM CCCP as indicated. At the arrows 500-ms depolarizations were applied. A postexperimental calibration procedure (see Materials and Methods) provided parameters for conversion of rhod-2 and Calcium Green fluorescence to the indicated mitochondrial and cytosolic free Ca2+ concentrations (Cam and Cac, respectively). The results shown are representative of four similar experiments. (Insets) The initial portions of Cam and Cac responses are aligned in time to the depolarizing stimulus.
Figure 6
Figure 6
Reversible elimination of the sustained phase of Cac recovery by blockade of mitochondrial Ca2+ extrusion. Cells were coloaded with rhod-2 and Calcium Green esters, examined in the perforated patch clamp configuration, and the data analyzed as in Fig. 4. Responses are representative of five similar experiments. (A) Arrows mark the application of sequential depolarizations of 1.5, 2.0, and 2.5 s duration, applied to a single cell in the presence or absence of perfusion with 10 μM CGP-37157 as indicated. (B) Another cell received 0.5, 1.0, and 1.5 s stimuli before, during, and after application of inhibitor.
Figure 8
Figure 8
Calcium-induced release of Ca2+ and its mitochondrial sequestration. Cells were coloaded with rhod-2 and Calcium Green and examined in perforated patch as in Fig. 4. (A) Calibrated (left) and aligned (right) Cam and Cac records are from a single cell subjected to sequential depolarizations of 50 (diamond), 100 (box), 250 (circle), and 500 (triangle) ms depolarizations, applied at the arrows. Results are representative of four similar experiments. (B) Averaged responses from four cells treated exactly as above. The enlarged, closed symbols mark the observed or interpolated Cam and Cac values at the termination of stimulus.
Figure 5
Figure 5
Cam increases during and following Ca2+ entry and decreases during late clearance. Rhod-2 was loaded as its AM ester and Calcium Green Dextran by whole cell dialysis. Calcium Green fluorescence observed in the on-cell patch clamp configuration was subtracted before calibration of signals simultaneously recorded from a single cell 5 min after the whole-cell configuration was established. (A) Cam and Cac responses to a 500-ms depolarization applied at the arrow. The final portion of Cac recovery is shown (dots) on a 20× expanded scale. (B) The initial portions of Cam (open circle) and Cac (open triangle) traces from A are aligned in time to the depolarizing stimulus. (C) The relationship of Cam to Cac during this response to stimulus and subsequent recovery; a closed diamond marks the Cam and Cac values at the termination of stimulus. The curved arrow indicates the approximate nonlinear time course; the lines divide elapsed time into segments of ∼0.5, 5, and 50 s duration.
Figure 7
Figure 7
Similar mitochondrial responses to calcium entry and to calcium mobilization by agonists. Cells were coloaded with rhod-2 and Calcium Green esters, examined in perforated patch, and the data analyzed, all as in Fig. 4. Each record is representative of 3–5 similar experiments. (A) At the indicated times a single cell was perfused with 100 nM bradykinin (BK) for 5 s. After recovery, a 250-ms depolarization (ΔV) was applied. (B) Cam and Cac responses of another cell to a 5-s perfusion with 50 μM muscarine (musc) and subsequent depolarization.
Figure 9
Figure 9
Mitochondrial sequestration of Ca2+ released from caffeine-sensitive stores. Cells were coloaded with rhod-2 and Calcium Green and examined in perforated patch as in Fig. 4. (A) Cam and Cac responses from another cell subjected to sequential depolarizations of 0.5 s applied before (circle), and of 1.0 or 1.5 s (box) applied after perfusion with 10 mM caffeine and 10 μM BHQ. (B) Averaged responses from three cells treated exactly as above. The enlarged, closed symbols mark the observed Cam and Cac values at the termination of stimulus. The intermediate response to the first depolarization applied after treatment is not shown, to avoid excessive overlap of records.

References

    1. Agard DA, Hiraoka Y, Shaw P, Sedat JW. Fluorescence microscopy in three dimensions. Methods Cell Biol. 1989;30:353–377. - PubMed
    1. Budd SL, Nichols DG. A reevaluation of the role of mitochondria in neuronal Ca2+homeostasis. J Neurochem. 1996;66:403–411. - PubMed
    1. Burnier M, Centeno G, Burki E, Brunner HR. Confocal microscopy to analyze cytosolic and nuclear calcium in cultured vascular muscle cells. Am J Physiol. 1994;266:C1118–C1127. - PubMed
    1. Carafoli E. The calcium cycle of mitochondria. FEBS Lett. 1979;104:1–5. - PubMed
    1. Chen, H., J.R. Swedlow, M. Gote, J.W. Sedat, and D.A. Agard. 1995. The collection, processing, and display of digital three-dimensional images of biological specimens. In Handbook of Biological Confocal Microscopy. J.B.Pawley, editor. Plenum Press, NY. 197–210.

Publication types

MeSH terms