. 1997 Mar 4;94(5):1779-84.
doi: 10.1073/pnas.94.5.1779.

Submillisecond protein folding kinetics studied by ultrarapid mixing

Affiliations

Submillisecond protein folding kinetics studied by ultrarapid mixing

C K Chan et al. Proc Natl Acad Sci U S A. .

Abstract

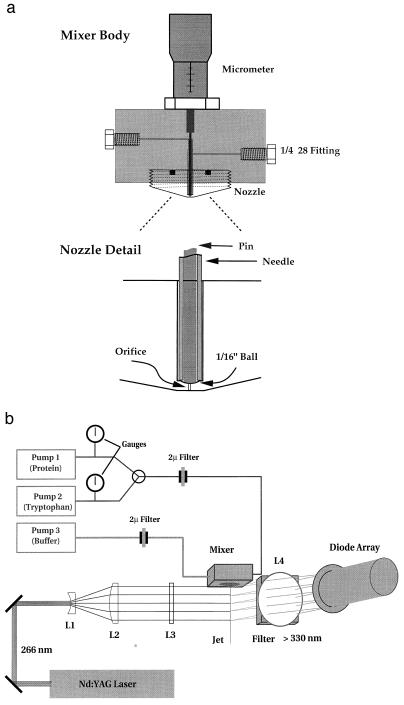
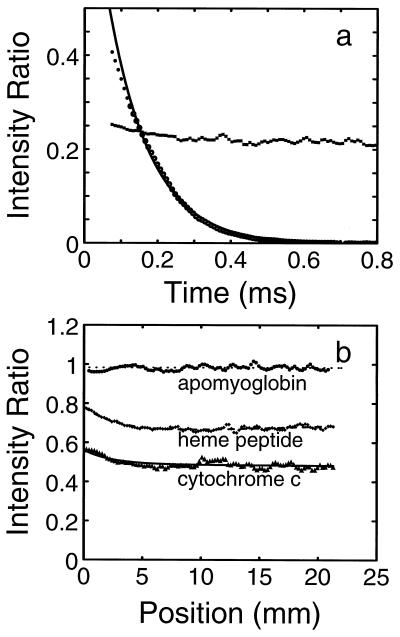
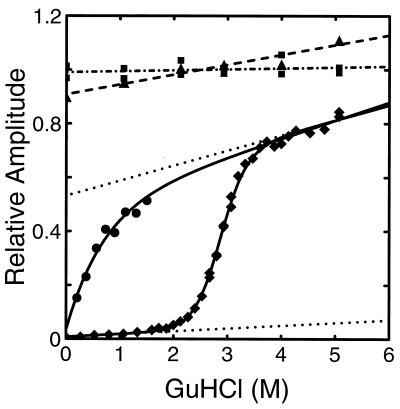
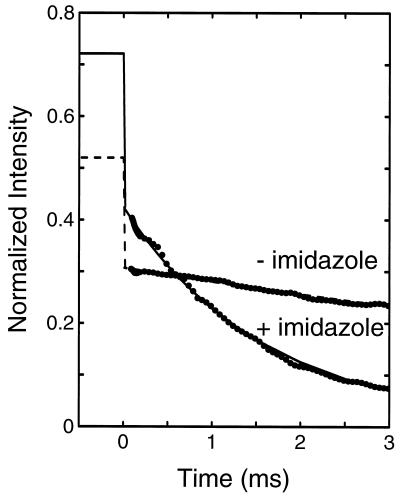
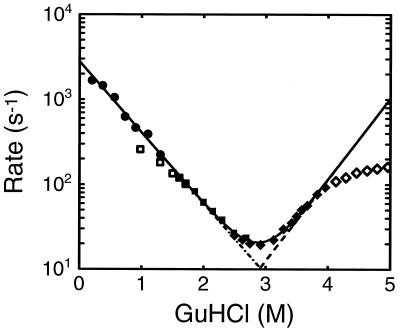
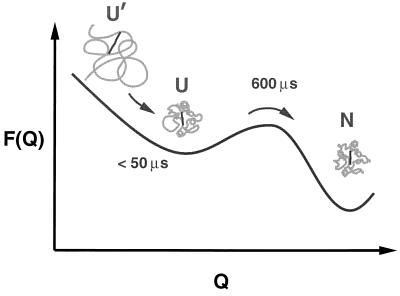
An ultrarapid-mixing continuous-flow method has been developed to study submillisecond folding of chemically denatured proteins. Turbulent flow created by pumping solutions through a small gap dilutes the denaturant in tens of microseconds. We have used this method to study cytochrome c folding kinetics in the previously inaccessible time range 80 micros to 3 ms. To eliminate the heme-ligand exchange chemistry that complicates and slows the folding kinetics by trapping misfolded structures, measurements were made with the imidazole complex. Fluorescence quenching due to excitation energy transfer from the tryptophan to the heme was used to monitor the distance between these groups. The fluorescence decrease is biphasic. There is an unresolved process with tau < 50 micros, followed by a slower, exponential process with tau = 600 micros at the lowest denaturant concentration (0.2 M guanidine hydrochloride). These kinetics are interpreted as a barrier-free, partial collapse to the new equilibrium unfolded state at the lower denaturant concentration, followed by slower crossing of a free energy barrier separating the unfolded and folded states. The results raise several fundamental issues concerning the dynamics of collapse and barrier crossings in protein folding.


Figures

Figure 1
Figure 1
Schematic of ultrarapid-mixing continuous-flow mixer.
Figure 2
Figure 2
Control experiments. (a) Determination of mixing efficiency and apparent dead time. The characteristics of the mixer were probed by measuring the quenching of tryptophan fluorescence by iodide under conditions identical to those used in the folding experiments (▪). The relative fluorescence intensity observed after mixing (0.2) is close to that determined from a Stern–Volmer plot at the same NaI concentration, and the time independence of the measured value indicates that the solutions are well mixed. The time delay between mixing and the first observation point (dead time of the mixer) was determined from measurement of the disappearance of N-acetyltryptophanamide (NATA) fluorescence (•) due to the reaction with N-bromosuccinimide (NBS) (37). Under the conditions of the experiment ([NATA] = 40 μM; [NBS] = 4 mM), this reaction is pseudo-first-order and the dead time of the mixer can then be calculated by back-extrapolating the exponential fit of the observed amplitudes (continuous curve) to the initial fluorescence amplitude. Dead times of 80 μs and 200 μs were determined for the 50-μm- and 100-μm-diameter nozzles, respectively. (b) Control experiments on scattering and self-absorption in the jet. Measured data are shown for apomyoglobin, an equimolar mixture of the heme peptide of cytochrome c (residues 11–21 attached to the heme), and cytochrome c after 5:1 dilution in 4.4 M guanidine hydrochloride (Gdn·HCl).
Figure 3
Figure 3
Equilibrium unfolding curve and initial amplitudes from folding experiments. The fluorescence intensity resulting from 266-nm excitation of cytochrome c (♦, solid curve), tryptophan (▪, dot–dash line), and the 55–63 nonapeptide (▴, dashed line) are plotted versus Gdn·HCl concentration. The solutions contained 0.2 M imidazole, 0.1 M potassium phosphate at pH 7, and various concentrations of Gdn·HCl at 20°C. The dotted lines describe the (assumed) Gdn·HCl-dependent fluorescence of the folded and unfolded states obtained from a two-state fit to both the equilibrium (♦) and kinetic data (Fig. 5). This fit produced Cm = 2.85, m = 2.43 for the midpoint and slope of the folding curve, respectively; the {slope, intercept} of the native and unfolded baselines are {0.010, 0.008} and {0.056, 0.532}, respectively. The equilibrium constant was scaled by a factor of 1.28 in the best fit. (See footnote on later page.) The corresponding values obtained from a fit to the equilibrium data alone were Cm = 2.86, m = 2.85; with native and unfolded baseline parameters {0.23, 0.001} and {0.069, 0.472}. Also shown are the initial (∼100-μs) amplitudes of the kinetic data obtained from continuous-flow experiments (Figs. 4 and 5) (•). The solid curve through these data is a fit to the empirical equation Amplitude = 0.49 + 0.388[Gdn·HCl] − 0.443 exp(−1.45[Gdn·HCl]).
Figure 4
Figure 4
Kinetics of cytochrome c folding in the presence and absence of imidazole following dilution of chemical denaturant. Cytochrome c in 4.4 M Gdn·HCl (0.2 M imidazole/0.1 M potassium phosphate buffer, pH 7) was diluted 6-fold with buffer (0.2 M imidazole/0.1 M potassium phosphate, pH 7) to a final Gdn·HCl concentration of 0.7 M at 20°C. The total fluorescence intensity at wavelengths longer than 320 nm was measured relative to tryptophan, and has been scaled as described in the text. The values at negative times indicate the expected intensity at zero time, calculated by correcting the intensity at 4.4 M Gdn·HCl for the influence of Gdn·HCl as determined from the nonapeptide. The intensity at 0.7 M Gdn·HCl for the 1–65 fragment is 0.4 (7). The lines show exponential fits to the data, with relaxation times of 1.6 ms (solid line) and 10.9 ms (broken line).
Figure 5
Figure 5
Folding and unfolding rates as a function of Gdn·HCl concentration. •, Rates obtained from exponential fits to data from continuous-flow experiments (e.g., Fig. 4). ▪ and □, Rates obtained from stopped-flow folding experiments in which solutions were mixed from 4.4 M Gdn·HCl to the indicated final concentration. ♦ and ⋄ Rates obtained from stopped-flow experiments in which solutions of native protein in aqueous buffer were mixed to the indicated final Gdn·HCl concentration. Reciprocal relaxation times (solid line), folding rates (dot–dash line]), and unfolding rates (dashed line) obtained from simultaneous fit to kinetic and equilibrium data using the two-state model. Only the filled data points were included in the fit. The unfilled points from the stopped-flow experiments at low Gdn·HCl concentration were not included in the fits because most of the decay cannot be observed. The origin of the curvature in the stopped-flow data at high Gdn·HCl concentration remains unknown (30, 31).
Figure 6
Figure 6
Schematic diagram of partial collapse followed by barrier crossing. The free energy is shown as a function of the effective reaction coordinate, Q, which measures the similarity to the native structure (N). One choice for Q, for example, is the fraction of the contacts between residues that are found in the native structure (8). At 4.4 M Gdn·HCl the protein is nearly a random coil (U′). Upon dilution of the denaturant the increased intrachain interactions produce a partial collapse in less than ∼50 μs, which is followed by crossing the free energy barrier separating the equilibrium unfolded (U) and folded states with a relaxation time of 600 μs at the lowest denaturant concentration studied.

References

    1. Anfinsen C B. Science. 1973;181:223–230. - PubMed
    1. Jaenicke R. Prog Biophys Molec Biol. 1987;49:117–237. - PubMed
    1. Jackson S E, Fersht A R. Biochemistry. 1991;30:10428–10435. - PubMed
    1. Kiefhaber T. Proc Natl Acad Sci USA. 1995;92:9029–9033. - PMC - PubMed
    1. Schindler T, Herrier M, Marahiel M A, Schmid F X. Nat Struct Biol. 1995;2:663–679. - PubMed

Publication types

LinkOut - more resources