Clinical Trial
. 1997 Mar 4;94(5):1967-72.
doi: 10.1073/pnas.94.5.1967.

Glutathione deficiency is associated with impaired survival in HIV disease

Affiliations
Clinical Trial

Glutathione deficiency is associated with impaired survival in HIV disease

L A Herzenberg et al. Proc Natl Acad Sci U S A. .

Abstract

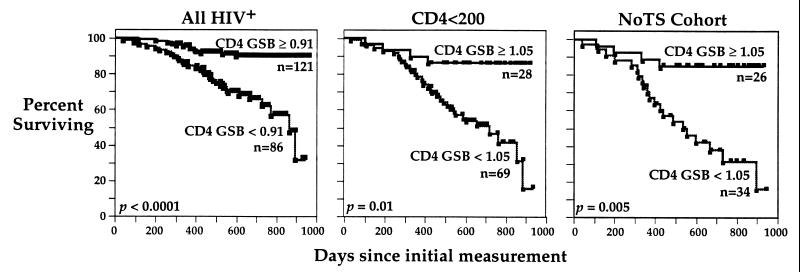
Glutathione (GSH), a cysteine-containing tripeptide, is essential for the viability and function of virtually all cells. In vitro studies showing that low GSH levels both promote HIV expression and impair T cell function suggested a link between GSH depletion and HIV disease progression. Clinical studies presented here directly demonstrate that low GSH levels predict poor survival in otherwise indistinguishable HIV-infected subjects. Specifically, we show that GSH deficiency in CD4 T cells from such subjects is associated with markedly decreased survival 2-3 years after baseline data collection (Kaplan-Meier and logistic regression analyses, P < 0.0001 for both analyses). This finding, supported by evidence demonstrating that oral administration of the GSH prodrug N-acetylcysteine replenishes GSH in these subjects and suggesting that N-acetylcysteine administration can improve their survival, establishes GSH deficiency as a key determinant of survival in HIV disease. Further, it argues strongly that the unnecessary or excessive use of acetaminophen, alcohol, or other drugs known to deplete GSH should be avoided by HIV-infected individuals.


Figures

Figure 1
Figure 1
FACS measurement of CD4 T cell GSB fluorescence reflects intracellular GSH levels. GSB is the intracellular fluorescent conjugate of GSH and monochlorobimane. (Top Right) Sample FACS histogram of the GSB fluorescence distribution for CD4 T cells (i.e., GSB in CD4+CD3+ cells) from a single subject. Median (50th percentile) GSB fluorescence levels were computed as shown for each subset in each subject and normalized to the median GSB level for lymphocytes in a PBMC standard analyzed with the samples. Normalized baseline values for the various subsets, labeled as GSB, are shown. (Top Left) This panel relates the median CD4 T cell GSB fluorescence levels to whole blood GSH levels (determined by HPLC) for 53 NAC trial subjects (▪) and 17 male uninfected controls (+). Three HIV-infected outliers (×) were excluded from the analysis (r = 0.56, P < 0.0001 with the outliers included). (Bottom) These panels relate the GSB levels in PBMC subsets from 209 HIV-infected and 82 uninfected subjects. Density ellipses (ovals) include 95% of the points; Pearson correlation coefficient (r) and significance values are computed from a bivariate normal distribution fit (26).
Figure 2
Figure 2
CD4 T cell GSB is lost progressively in HIV disease. Distribution of median baseline GSB levels in CD4 T cells. The vertical bar placed at 1.05 on the GSB axis locates the optimal value (computed by ROC analysis) for discriminating survivors from nonsurvivors among subjects with CD4 counts below 200/μl. Numbers of subjects and statistical data for groups shown are reported in Table 1. See Methods for GSB units; see legend to Table 1 for definition of the NoTS cohort.
Figure 3
Figure 3
Survival increases with increasing GSB levels. Logistic regressions in the figure estimate the probability that an individual with a given baseline GSB level (in CD4 T cells) will survive for the entire observation period (2–3 years). None of the subjects showed evidence of debilitating illness at baseline. The regression for the NoTS cohort predicts 65 ± 15% survival for subjects at the mean GSB level for the cohort (0.98); 50% survival for subjects with GSB levels of 0.85 (0.57–1.0, 95% confidence interval); and <40% survival for subjects with GSB levels below 0.72, the mean for subjects in the NAC trial. Histograms show the GSB distributions for survivors (lower histograms) and for nonsurvivors (upper histograms).
Figure 4
Figure 4
Low GSB levels predict poor survival. Kaplan–Meier analyses of survival. Subjects are subdivided according to baseline GSB levels (in CD4 T cells); thresholds were determined by ROC analysis. Additional Kaplan–Meier survival analyses (not shown) confirm the previously demonstrated poor prognosis of HIV-infected individuals with low CD4 T cell counts (43 subjects) and hematocrit levels (44 subjects) (P < 0.001 and P = 0.004, respectively, at the optimal threshold computed by ROC for the group with CD4 < 200).
Figure 5
Figure 5
Oral administration of NAC increases whole blood GSH. Whole blood GSH was measured by HPLC. HIV-infected subjects were treated for 8 weeks with orally administered NAC (n = 27) or placebo (n = 26) in a randomized double-blind trial. One very high “outlier” was excluded from the placebo group (P value for comparison at 8 weeks when not excluded = 0.02). Subjects took 3,200–8,000 mg of NAC per day for 8 weeks (median, 4,400 mg). Significance was determined by the Anova t test. The bar in the “means diamond” shows the mean and the vertices show the 95% confidence interval for each group (26). Data for 17 uninfected male controls are shown. A complete report of the trial will be presented elsewhere.
Figure 6
Figure 6
Oral administration of NAC is associated with increased survival in AIDS. Data are shown only for subjects with CD4 T cell counts below 200/μl followed for up to 2 years. Subjects took NAC (median, 4,400 mg/day) for 8–32 weeks (median, 24 weeks; interquartile range, 12–27 weeks). Survival times for subjects who took NAC are computed from initiation of NAC administration (0 week for NAC arm; 8 weeks after the trial began for placebo arm). Survival times for subjects who did not take NAC are computed from the trial entry or screening date. All subjects who took NAC were enrolled in the NAC replenishment trial: 13 were randomized to the NAC arm; 12 were randomized to the placebo arm and elected to take open-label NAC during the trial continuation phase. Subjects in the No-NAC group were either enrolled in the NAC trial or met the basic criteria for trial entry (3 completed the placebo arm and declined open-label NAC; 9 left the trial, mainly within a week, citing symptoms such as nausea and rash, which were similar to symptoms reported by subjects who completed the trial; 5 declined to enter the trial for personal reasons; and 2 were disqualified for trial entry only because they had recently changed their reverse transcriptase inhibitor regimen). No significant differences (P > 0.1) at baseline were detected between the NAC and No-NAC groups for the following measurements: absolute counts and GSB levels for CD4 and CD8 naive, memory, and overall T cell subsets, and for B cells, monocytes, and NK cells; hematocrit and other clinical laboratory tests; Karnofsky score; age, weight, and previous opportunistic infections. Of over 60 measurements tested, only plasma thioredoxin levels showed a significant difference between the NAC and No-NAC groups (the NAC group was lower, P = 0.01).

References

    1. Vina J, Vinar J R, Saez G T. Life Chem Rep. 1986;4:1–35.
    1. Dolphin D, Avramovic O, Poulson R. Glutathione: Coenzymes and Cofactors. New York: Wiley; 1989. Vols. 3A and 3B.
    1. Taniguchi N, Higashi T, Sakamoto Y, Meister A. Glutathione Centennial. New York: Academic; 1989.
    1. Poot M, Teubert H, Rabinovitch P S, Kavanagh T J. J Cell Physiol. 1995;163:555–560. - PubMed
    1. Adamson D C, Wildemann B, Sasaki M, Glass J D, McArthur J c, Christov V I, Dawson T M, Dawson V L. Science. 1996;274:1917–1919. - PubMed

Publication types