. 1997 Apr 1;17(7):2429-44.
doi: 10.1523/JNEUROSCI.17-07-02429.1997.

Development of multisensory neurons and multisensory integration in cat superior colliculus

Affiliations

Development of multisensory neurons and multisensory integration in cat superior colliculus

M T Wallace et al. J Neurosci. .

Abstract

The development of multisensory neurons and multisensory integration was examined in the deep layers of the superior colliculus of kittens ranging in age from 3 to 135 d postnatal (dpn). Despite the high proportion of multisensory neurons in adult animals, no such neurons were found during the first 10 d of postnatal life. Rather, all sensory-responsive neurons were unimodal. The first multisensory neurons (somatosensory-auditory) were found at 12 dpn, and visually responsive multisensory neurons were not found until 20 dpn. Early multisensory neurons responded weakly to sensory stimuli, had long latencies, large receptive fields, and poorly developed response selectivities. Most surprising, however, was their inability to integrate combinations of sensory cues to produce significant response enhancement (or depression), a characteristic feature of the adult. Responses to combinations of sensory cues differed little from responses to their modality-specific components. At 28 dpn an abrupt physiological change was noted. Some multisensory neurons now integrated combinations of cross-modality cues and exhibited significant response enhancements when these cues were spatially coincident and response depressions when the cues were spatially disparate. During the next 2 months the incidence of multisensory neurons, and the proportion of these neurons capable of adult-like multisensory integration, gradually increased. Once multisensory integration appeared in a given neuron, its properties changed little with development. Even the youngest integrating neurons showed superadditive enhancements and spatial characteristics of multisensory integration that were indistinguishable from the adult. Nevertheless, neonatal and adult multisensory neurons differed in the manner in which they integrated temporally asynchronous stimuli, a distribution that may reflect the very different behavioral requirements at different ages. The possible maturational role of corticotectal projections in the abrupt gating of multisensory integration is discussed.


Figures

Fig. 1.
Fig. 1.
The developmental chronology of multisensory neurons. The percentage of multisensory neurons in the deep layer sensory-responsive population is plotted as a function of postnatal age. Pie charts in the inset show the expansion of the multisensory population as development progresses.
Fig. 2.
Fig. 2.
The incidence of sensory-responsive neurons (i.e., unimodal and multisensory) in the deep SC increases with increasing postnatal age. Shown are representative histological reconstructions of coronal sections through the SC mapping the location of unimodal and multisensory neurons in individual animals at six developmental stages.Vertical lines on each section represent electrode penetrations, and the location of each recorded sensory-responsive neuron is depicted with a circle (open circles = unimodal neurons; closed circles = multisensory neurons; V, visual;A, auditory; S, somatosensory;VA, visual–auditory, etc.). Scale bar, 1 mm.SGS, Stratum griseum superficiale; SO, stratum opticum; SGI, stratum griseum intermediale;SAI, stratum album intermediale; SGP, stratum griseum profundum; SAP, stratum album profundum,PAG, periaqueductal gray.
Fig. 3.
Fig. 3.
The development of unimodal response latencies in multisensory neurons. Errors bars represent SEM.
Fig. 4.
Fig. 4.
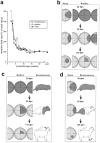
The receptive fields of multisensory neurons decline substantially in size during development. a, Receptive field size (as a percentage of the mean adult value) is plotted as a function of postnatal age. Note the rapid decline for each modality-specific receptive field during the first 4–6 weeks.b, Representative receptive fields (shading) of visual–auditory neurons at three ages (22, 42, and 135 dpn) are plotted onto representations of visual and auditory space. Frontal auditory space is represented on the central hemisphere, and caudal space is represented by a hemisphere that has been split and both halves have been folded forward. Eachconcentric circle represents 10°. c, Representative receptive fields of auditory–somatosensory neurons at three ages (20, 42, and 115 dpn). An arrow points to the small somatosensory receptive field at 115 dpn. d, Representative receptive fields of visual–somatosensory neurons at three ages (20, 42, and 135 dpn). An arrow points to the small somatosensory receptive field at 135 dpn. n, Nasal; T, temporal; S, superior;I, inferior.
Fig. 5.
Fig. 5.
The development of auditory response categories in multisensory neurons. Initially, auditory responses can be elicited from multisensory neurons by stimuli positioned in both contralateral and ipsilateral space. These “omnidirectional” neurons respond to the pairing of stimuli from both sides, with either no interaction (CI) or an enhanced response (CI/E). During development, other response categories appear that reflect the appearance of more discrete excitatory receptive fields (see text). C, Response to contralateral stimulus; I, response to ipsilateral stimulus; O, no response; E, enhanced response to contralateral-ipsilateral pairing; D, depressed response to contralateral-ipsilateral pairing. Numbers in parentheses above pie charts represent the number of neurons in each postnatal age grouping.
Fig. 6.
Fig. 6.
The earliest multisensory neurons do not integrate cross-modality sensory cues to produce the response changes that characterize adults. This figure illustrates the responses of a visual–somatosensory neuron in a 20 dpn animal. Top, Visual and somatosensory receptive fields are depicted byshading and are shown for each of the three stimulus conditions. The visual stimulus is a bar of light moving in the direction and amplitude depicted by the bars andarrow within the receptive field. The somatosensory stimulus is a probe mounted onto a lever that deflects hairs and skin within the receptive field (probe movement depicted byarrow). Middle, Rasters, peristimulus histograms, and bar graphs illustrate the responses of this neuron to the unimodal and multisensory stimulus conditions. The electronic trace driving the stimulus (V, visual; S, somatosensory) is shown above the rasters. Each dot of the raster represents a single neuronal impulse, and each row of dots represents a single trial. The results of eight trials are shown for each stimulus condition. Bar graphs summarize the mean response for each condition. Note the absence of multisensory enhancement to the combination of unimodal stimuli. In fact, the combined response (VS) is somewhat less than the best unimodal response, a difference that failed to reach statistical significance. Error bars represent SEM, and the dashed line (sum) shows the predicted response on the basis of linear summation. Bottom, Representative oscillographic traces for a single trial of each of the conditions.
Fig. 7.
Fig. 7.
Multisensory neurons exhibiting the capacity to integrate cross-modality cues to significantly enhance (or depress) responses are first seen in the fifth postnatal week and are adult-like in many ways (for conventions, see Figs. 4 and 6). The auditory stimulus is a speaker, the position of which is depicted by the icon within the receptive field. Note the adult-like receptive fields and the significant response enhancement to the combination of the visual and auditory stimuli. ** p < 0.01.
Fig. 8.
Fig. 8.
As soon as multisensory neurons develop the capacity to integrate cross-modality cues, the magnitude of the enhancement they exhibit to spatially and temporally coincident stimuli is adult-like. This is evident from the line connecting the open squares. Nonetheless, because the number of integrative neurons matures gradually over time, the population profile takes ∼3 months to mature. Thus, the average enhancement for all multisensory neurons increases gradually as a function of postnatal age as shown by theline connecting the closed circles. The dashed line represents the mean adult level of multisensory enhancement.
Fig. 9.
Fig. 9.
Once initiated, the development of multisensory neurons capable of integrating cross-modality stimuli is rapid. The percentage of the multisensory population exhibiting significant (p < 0.05) integration is plotted here as a function of postnatal age. Note the delayed onset of multisensory integration, followed by the rapid rise in the proportion of neurons capable of such integration beginning at 5 weeks and reaching the adult-like proportion at 9–10 weeks.
Fig. 10.
Fig. 10.
A mixture of multisensory neurons incapable of integrating cross-modality cues (top) and those that had adult-like multisensory integration (bottom) was evident in the same animals. Note the large receptive fields in the “nonintegrating” neuron in this 35 dpn animal, and the adult-like receptive fields in the integrating neuron. * p < 0.05. See Figures 4 and 6 for conventions.
Fig. 11.
Fig. 11.
Receptive field size is an excellent predictor of the capacity for multisensory integration. The probability of adult-like multisensory integration in individual neonatal SC neurons is plotted as a function of receptive field size for each of the three modalities. Adult data (black bars) are shown for comparison. Note the high probability of integration for neonatal neurons with adult-size receptive fields and the precipitous decline in integrative probability for neurons with receptive field sizes >150% of the adult mean. Because receptive field size varies as a function of position in the SC (rostral receptive fields are smaller than caudal receptive fields), for the purposes of this analysis the SC was divided into four anterior–posterior zones. In this way, the receptive field size of a neonatal neuron was calculated as a percentage of the mean adult receptive field size within the same anterior–posterior zone.Numbers in parentheses show number of neurons in each category.
Fig. 12.
Fig. 12.
The spatial principle of multisensory integration was seen as soon as neurons developed the capacity to integrate cross-modality cues. This is illustrated in a 35 dpn visual–auditory neuron. At the top are shown the receptive fields of this neuron, with the region of receptive field overlap depicted inblack. In this paradigm, the visual stimulus was a bar of light moving in the direction of the arrow, while the auditory stimulus was presented at three different locations (A1, A2, andA3). When both stimuli were presented within their respective receptive fields (middle left andbottom), their combination resulted in a significant response enhancement. When the auditory stimulus was presented outside its receptive field (middle right), the visual–auditory stimulus combination produced significant response depression. * p < 0.05.
Fig. 13.
Fig. 13.
The temporal window in which multisensory integration takes place increases during development. a, The size of the temporal window is plotted as a function of postnatal age. b, Integration as a function of temporal delay in a 35 dpn visual–auditory neuron. V500A represents the visual stimulus preceding the auditory stimulus by 500 msec,A500V represents the converse, and 0 represents the simultaneous presentation of the two stimuli. Theshading shows the temporal window within which statistically significant interactions (* p < 0.05; ** p < 0.01) were generated. Note that in this case interactions were generated only at simultaneity.c, A similar plot for a 49 dpn visual–auditory neuron. Note the wider (100 msec) temporal window. d, A typical plot for an adult visual–auditory neuron. Note the wide (300 msec) temporal window and the significant response depression observed when the auditory stimulus preceded the visual stimulus by 500 msec (A500V).
Fig. 14.
Fig. 14.
The inverse effectiveness principle of multisensory integration was apparent in multisensory neurons as soon as they developed the capacity to integrate cross-modality cues. The six examples illustrated here, from single multisensory neurons in animals ranging in age from 20 dpn to the adult, showed a very similar relationship between the unimodal response and the integrative product: as the unimodal stimulus became more effective, the level of multisensory integration declined.

Similar articles

Cited by

References

    1. Baleydier C, Kahungu M, Mauguiere F. A crossed corticotectal projection from the lateral suprasylvian area in the cat. J Comp Neurol. 1983;214:344–351. - PubMed
    1. Berson DM. Cat lateral suprasylvian cortex: Y-cell inputs and corticotectal projections. J Neurophysiol. 1985;53:544–556. - PubMed
    1. Binns KE, Salt TE. Importance of NMDA receptors for multimodal integration in the deep layers of the cat superior colliculus. J Neurophysiol. 1996;75:920–930. - PubMed
    1. Clemo HR, Stein BE. Effects of cooling somatosensory cortex on response properties of tactile cells in superior colliculus. J Neurophysiol. 1986;55:1352–1368. - PubMed
    1. Cline HT, Constantine-Paton M. NMDA receptor agonists and antagonists alter retinal ganglion cell arbor structure in the developing frog retinotectal projection. J Neurosci. 1990;10:1197–1216. - PMC - PubMed

Publication types