

Endogenous FGF-2 is important for cholinergic sprouting in the denervated hippocampus
- PMID: 9065510
- PMCID: PMC6573508
- DOI: 10.1523/JNEUROSCI.17-07-02499.1997
Endogenous FGF-2 is important for cholinergic sprouting in the denervated hippocampus
Abstract
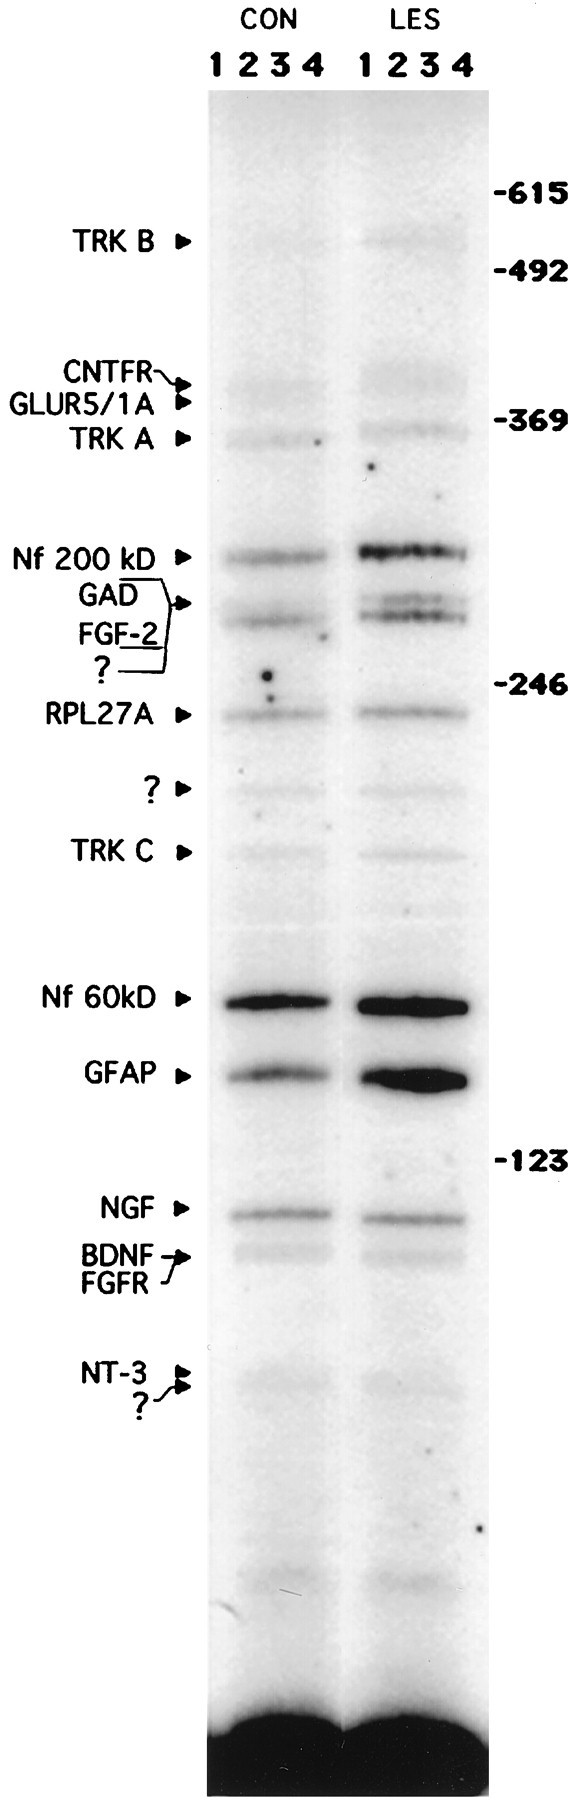
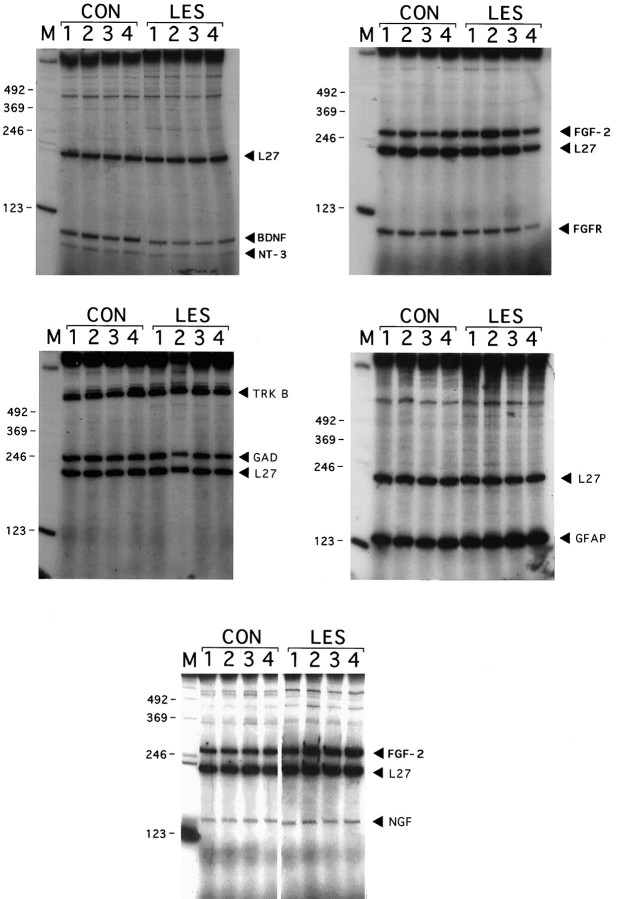
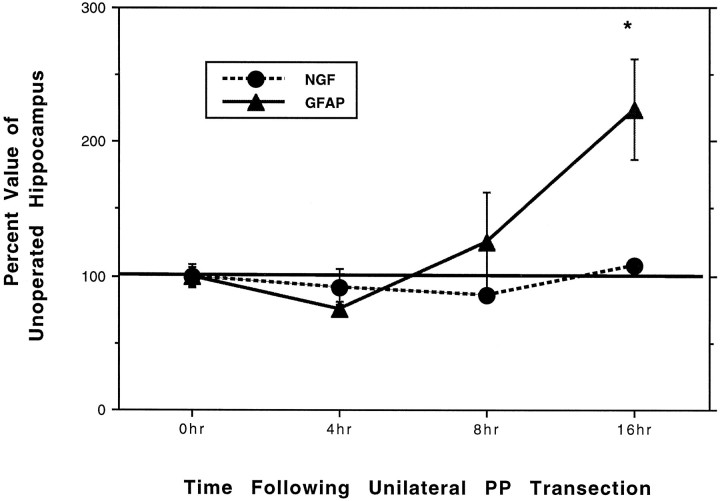
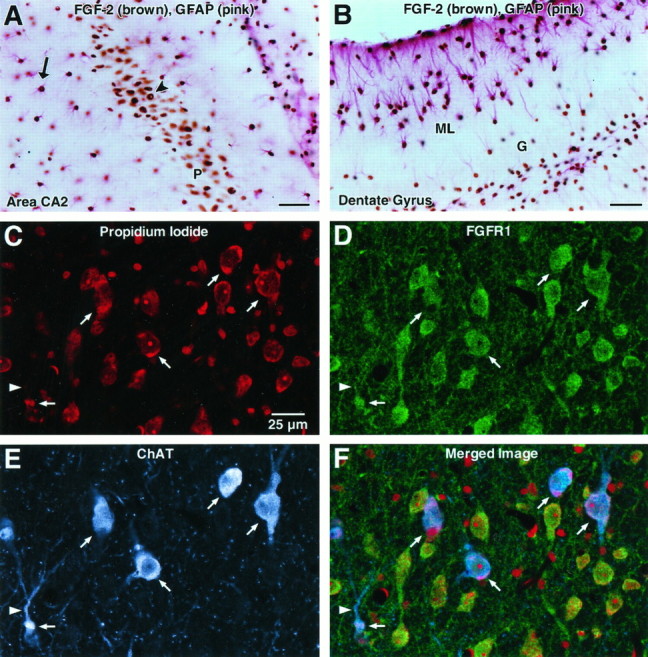
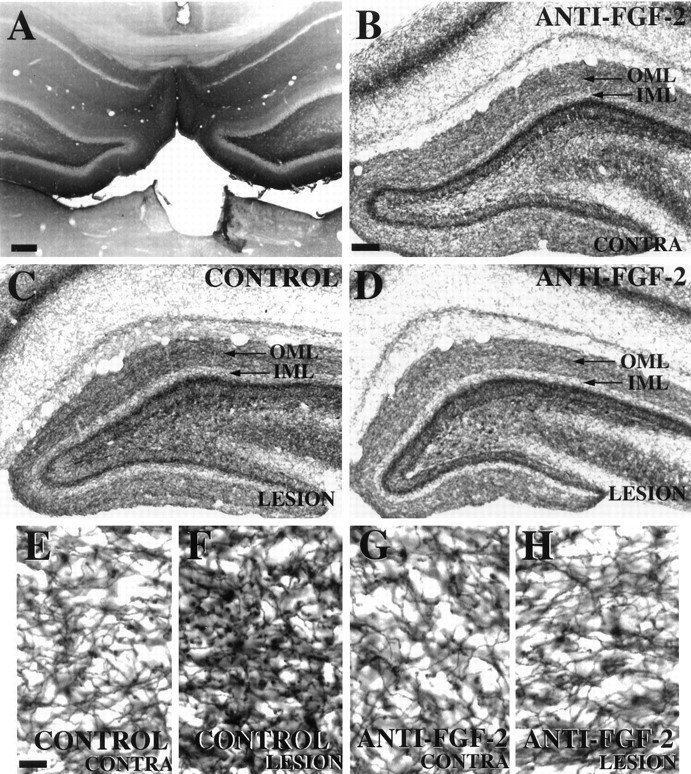
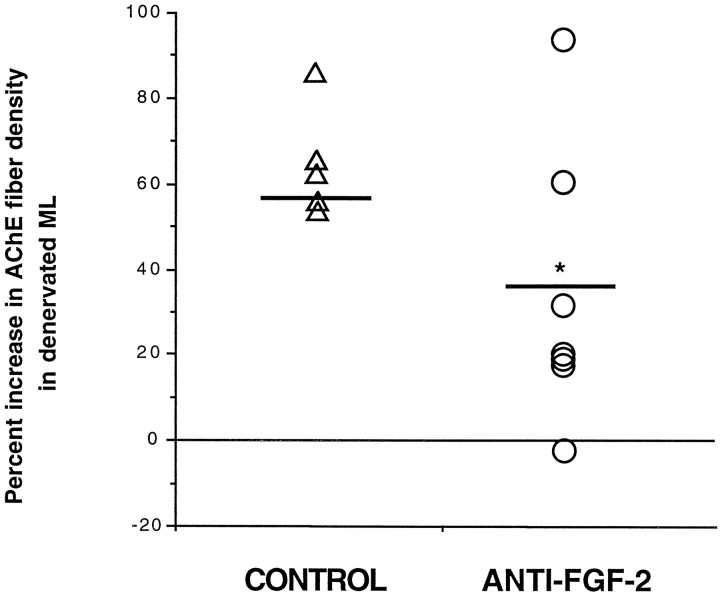
To investigate the molecular mechanisms of cholinergic sprouting in the hippocampus after removal of entorhinal cortical inputs, we evaluated trophic factor gene expression in the denervated hippocampus. Despite the proposed role for nerve growth factor (NGF) in this sprouting, we observed no change in NGF mRNA or protein at several postlesion time points. In contrast, FGF-2 mRNA was increased within 16 hr. FGF-2 immunoreactivity was localized within GFAP-positive hypertrophic astrocytes distributed specifically within the denervated outer molecular layer after the lesion. To address the functional significance of this increase in FGF-2, we assessed the magnitude of cholinergic sprouting in animals receiving chronic intracerebroventricular infusions of neutralizing antibodies specific for FGF-2 and compared it with that observed in lesioned animals receiving infusate controls. Animals given FGF-2 antibodies displayed a marked reduction in cholinergic sprouting as compared with controls. In fact, many of these animals exhibited virtually no sprouting at all despite histological verification of complete lesions. These results suggest that endogenous FGF-2 promotes cholinergic axonal sprouting in the injured adult brain. Furthermore, immunocytochemical localization of receptors for FGF-2 (i.e., FGFR1) on projecting basal forebrain cholinergic neurons suggests that FGF-2 acts directly on these neurons to induce the lesion-induced sprouting response.
Figures
Similar articles
-
Increased synthesis of heparin affin regulatory peptide in the perforant path lesioned mouse hippocampal formation.Exp Brain Res. 2000 Dec;135(3):319-30. doi: 10.1007/s002210000536. Exp Brain Res. 2000. PMID: 11146810
-
Changes in nerve growth factor immunoreactivity following entorhinal cortex lesions: possible molecular mechanism regulating cholinergic sprouting.J Comp Neurol. 1994 Jul 15;345(3):409-18. doi: 10.1002/cne.903450307. J Comp Neurol. 1994. PMID: 7929909
-
Vascular endothelial growth factor and its receptor Flk-1 are expressed in the hippocampus following entorhinal deafferentation.Neuroscience. 2005;134(4):1167-78. doi: 10.1016/j.neuroscience.2005.04.064. Neuroscience. 2005. PMID: 16039796
-
Basic FGF in adult rat brain: cellular distribution and response to entorhinal lesion and fimbria-fornix transection.J Neurosci. 1992 Jan;12(1):345-55. doi: 10.1523/JNEUROSCI.12-01-00345.1992. J Neurosci. 1992. PMID: 1309575 Free PMC article.
-
Dexamethasone induces hypertrophy of developing medial septum cholinergic neurons: potential role of nerve growth factor.J Neurosci. 1998 Nov 15;18(22):9326-34. doi: 10.1523/JNEUROSCI.18-22-09326.1998. J Neurosci. 1998. PMID: 9801371 Free PMC article.
Cited by
-
Fibroblast growth factor-2 promotes axon branching of cortical neurons by influencing morphology and behavior of the primary growth cone.J Neurosci. 2001 Jun 1;21(11):3932-41. doi: 10.1523/JNEUROSCI.21-11-03932.2001. J Neurosci. 2001. PMID: 11356881 Free PMC article.
-
Gold nanoparticle-enhanced X-ray microtomography of the rodent reveals region-specific cerebrospinal fluid circulation in the brain.Nat Commun. 2023 Jan 27;14(1):453. doi: 10.1038/s41467-023-36083-1. Nat Commun. 2023. PMID: 36707519 Free PMC article.
-
Central peptidergic neurons are hyperactive during collateral sprouting and inhibition of activity suppresses sprouting.J Neurosci. 1999 Mar 1;19(5):1586-98. doi: 10.1523/JNEUROSCI.19-05-01586.1999. J Neurosci. 1999. PMID: 10024346 Free PMC article.
-
Functional switch between motor tracts in the presence of the mAb IN-1 in the adult rat.Proc Natl Acad Sci U S A. 2001 Jun 5;98(12):6929-34. doi: 10.1073/pnas.111165498. Epub 2001 May 29. Proc Natl Acad Sci U S A. 2001. PMID: 11381120 Free PMC article.
-
Fibroblast growth factors in the management of spinal cord injury.J Cell Mol Med. 2018 Jan;22(1):25-37. doi: 10.1111/jcmm.13353. Epub 2017 Oct 24. J Cell Mol Med. 2018. PMID: 29063730 Free PMC article. Review.
References
-
- Abraham JA, Mergia A, Whang JL, Tumolo A, Friedman J, Hjerrild KA, Gospodarowicz D, Fiddes JC. Nucleotide sequence of a bovine clone encoding the angiogenic protein, basic fibroblast growth factor. Science. 1986;233:545–548. - PubMed
-
- Amaral DG, Avendano C, Cowan WM. The effects of neonatal 6-hydroxydopamine treatment on morphological plasticity in the dentate gyrus of the rat following entorhinal lesions. J Comp Neurol. 1980;194:171–191. - PubMed
-
- Anderson KJ, Dam D, Lee S, Cotman CW. Basic fibroblast growth factor prevents death of lesioned cholinergic neurons in vivo. Nature. 1988;332:360–361. - PubMed
-
- Baird A, Ling N. Fibroblast growth factors are present in the extracellular matrix produced by endothelial cells in vitro: implications for a role of heparinase-like enzymes in the neovascular response. Biochem Biophys Res Commun. 1987;142:428–435. - PubMed
-
- Barde YA. Trophic factors and neuronal survival. Neuron. 1989;2:1525–1534. - PubMed
Publication types
MeSH terms
Substances
Grants and funding
LinkOut - more resources
Full Text Sources
Other Literature Sources
Miscellaneous