Comparative Study
. 1997 Mar 24;136(6):1287-305.
doi: 10.1083/jcb.136.6.1287.

Identification of novel graded polarity actin filament bundles in locomoting heart fibroblasts: implications for the generation of motile force

Affiliations
Comparative Study

Identification of novel graded polarity actin filament bundles in locomoting heart fibroblasts: implications for the generation of motile force

L P Cramer et al. J Cell Biol. .

Abstract

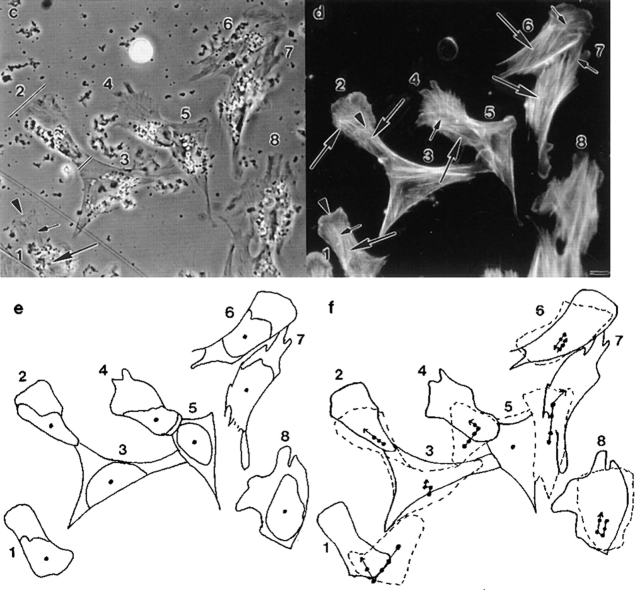
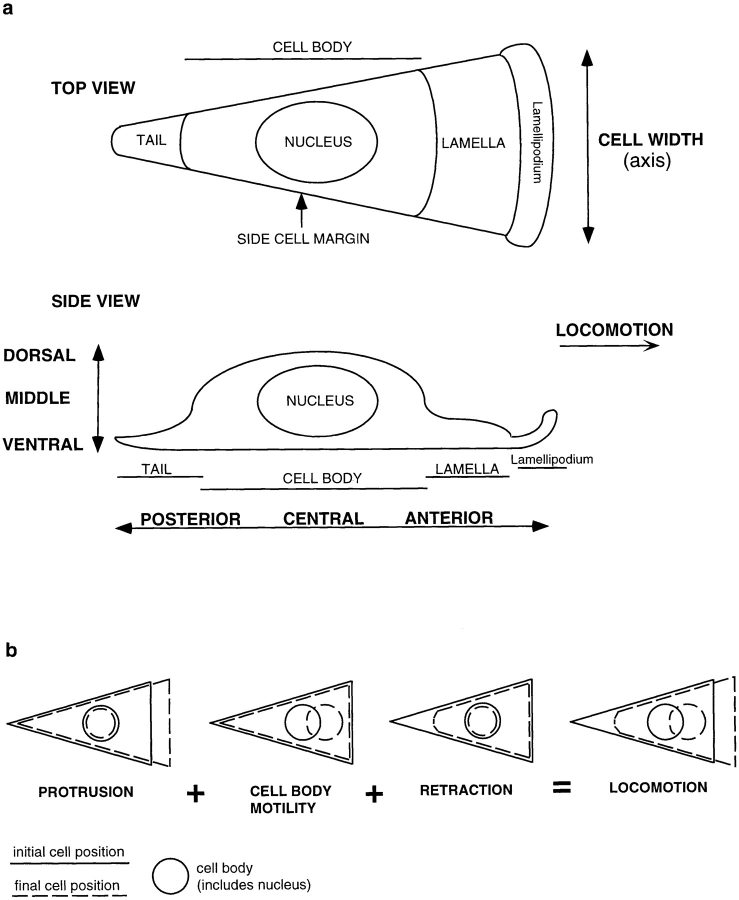
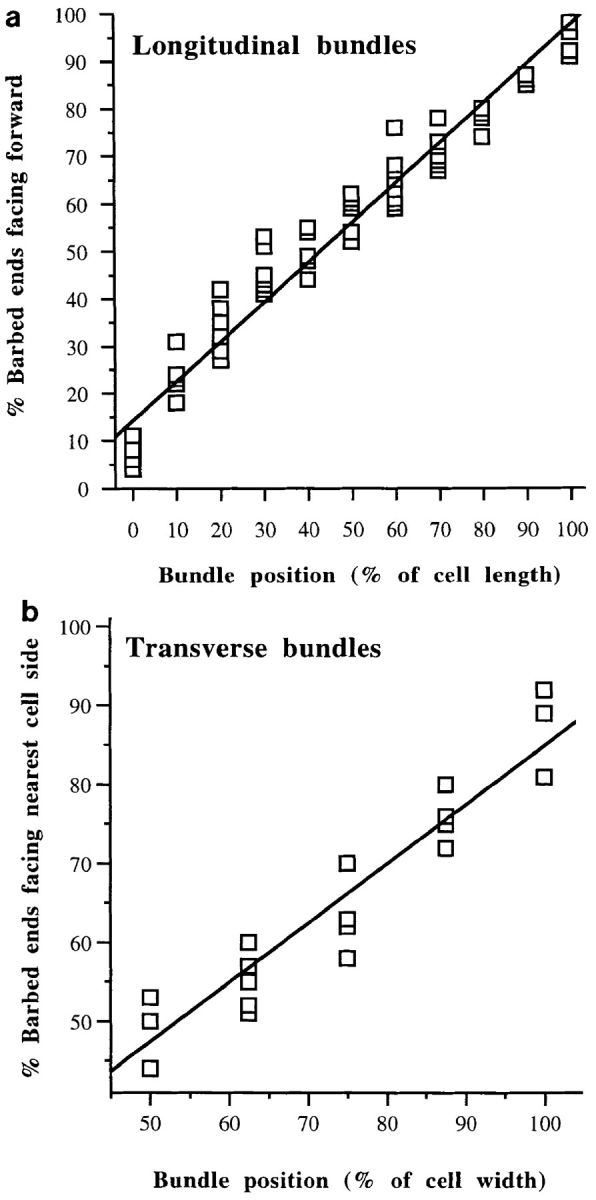
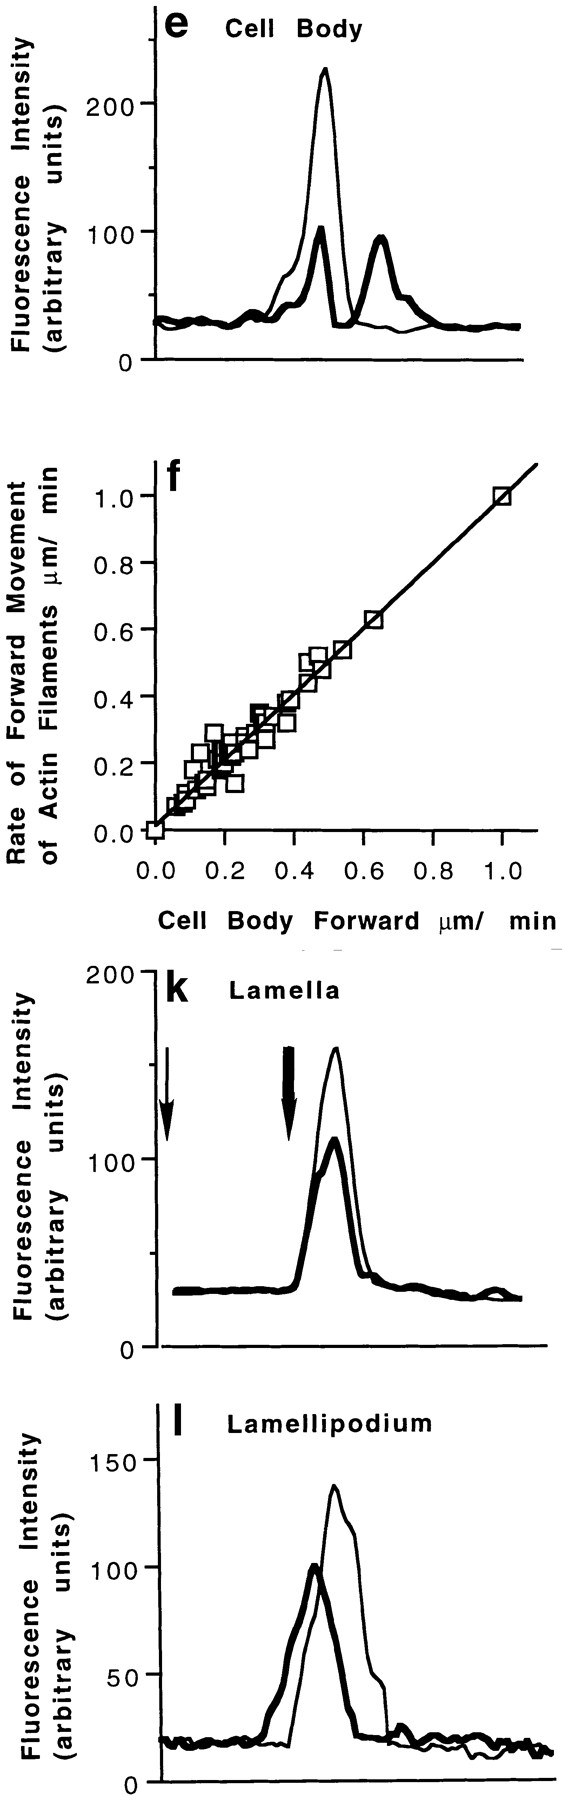
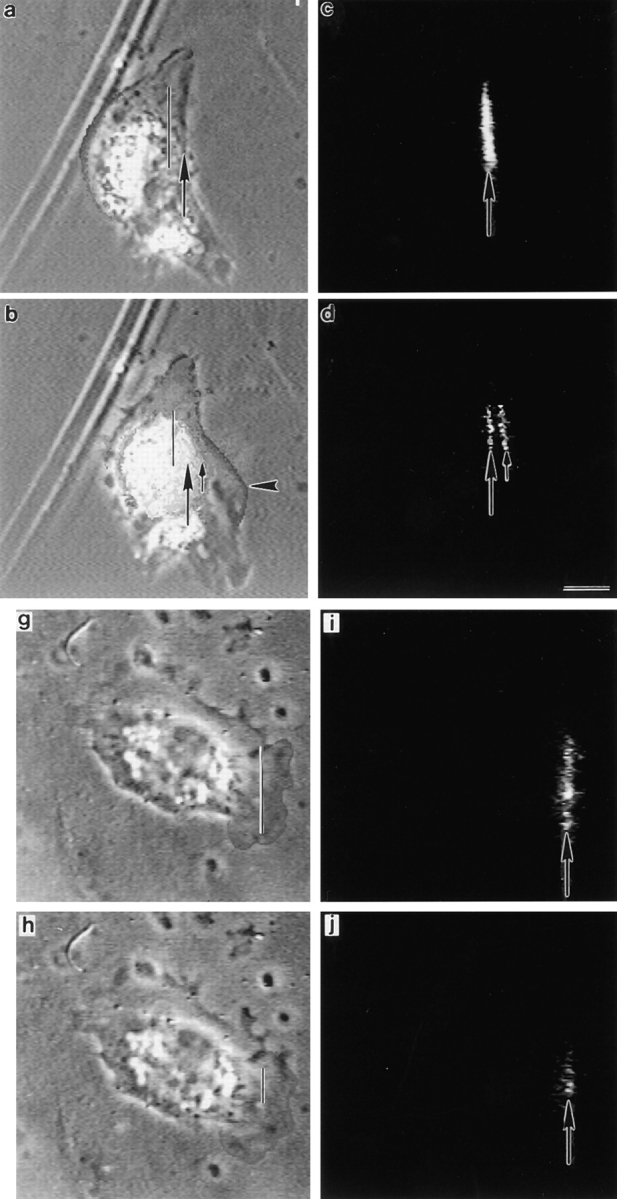
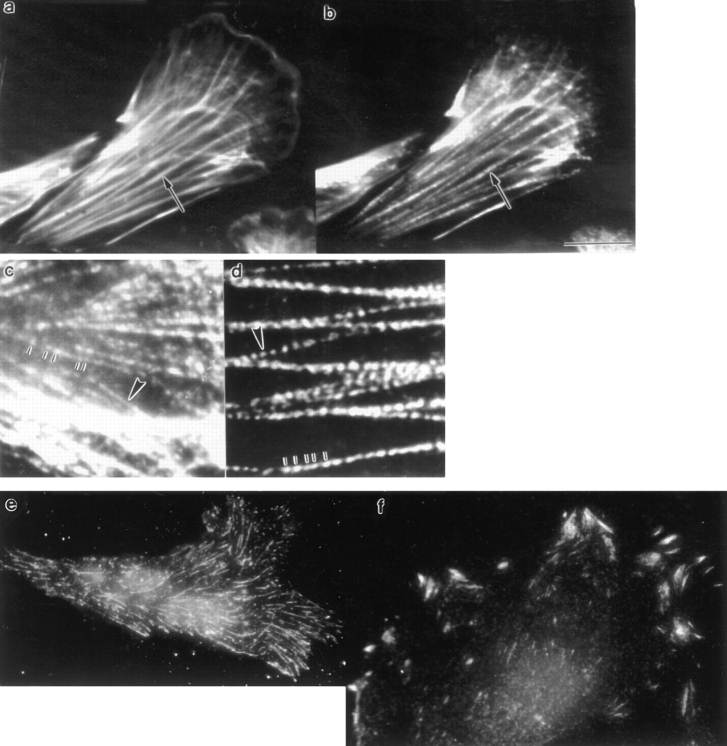
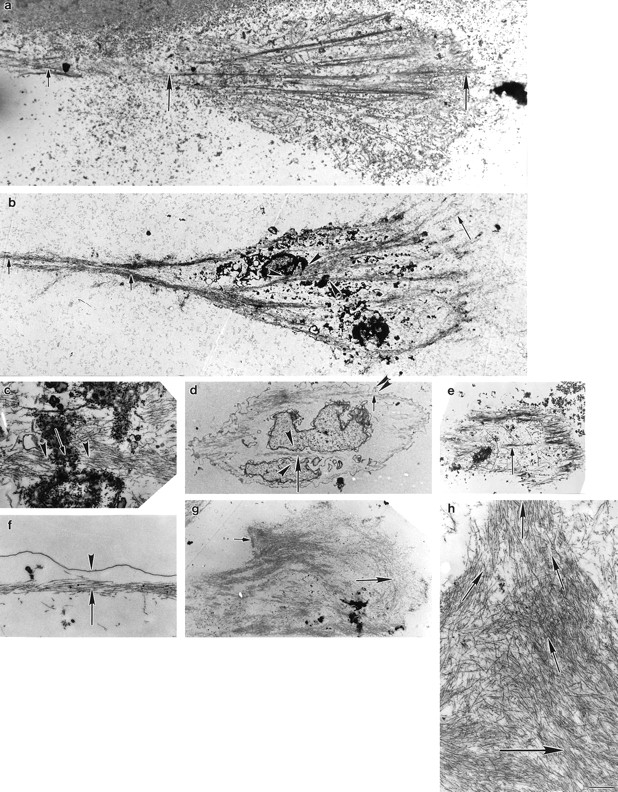
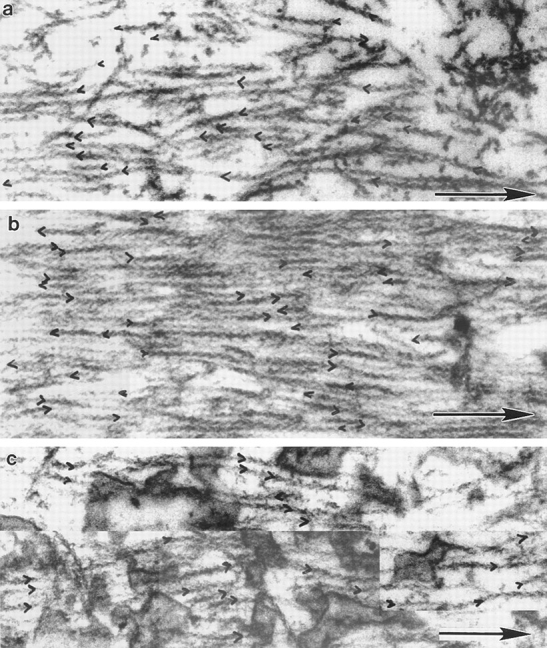
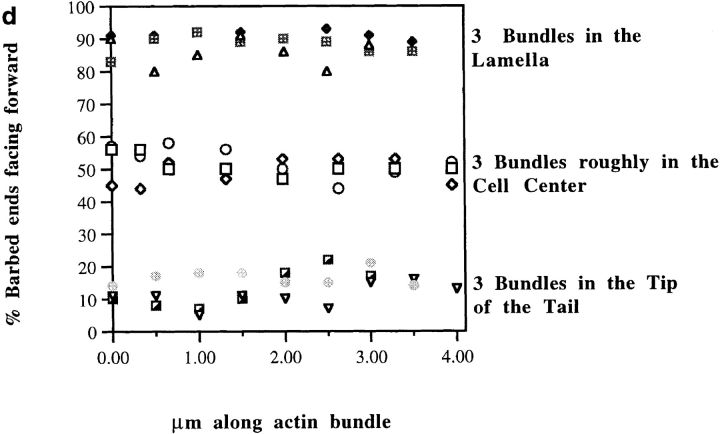
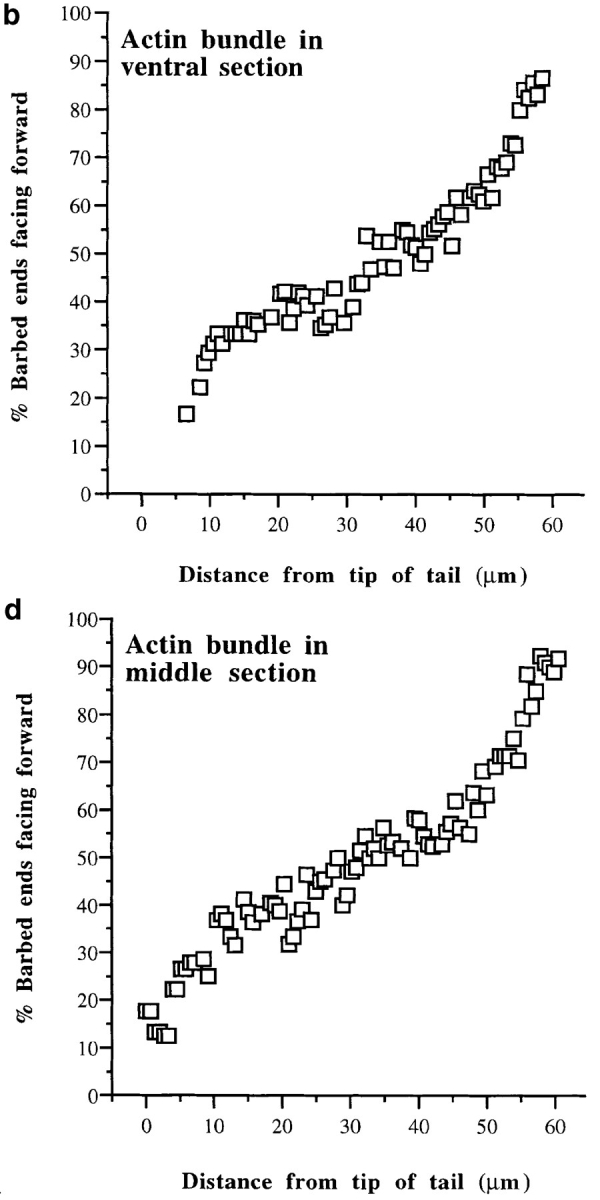
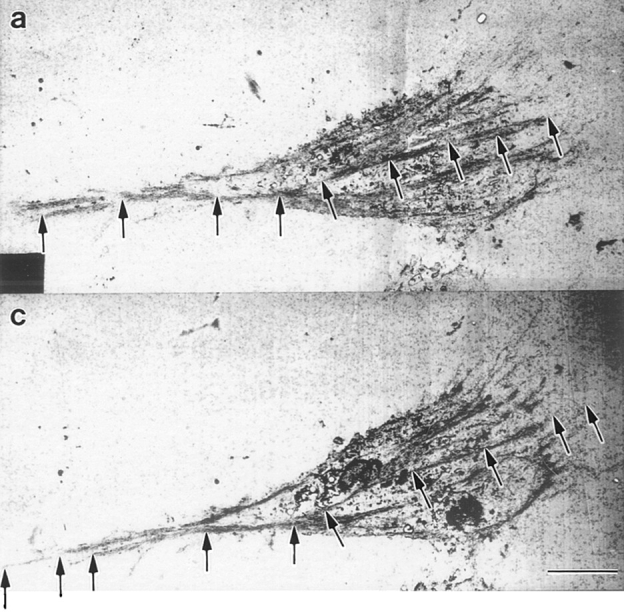
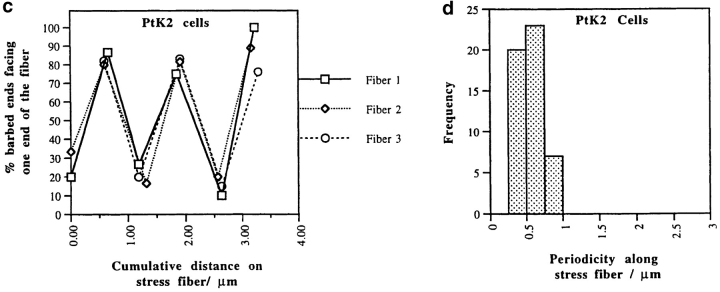
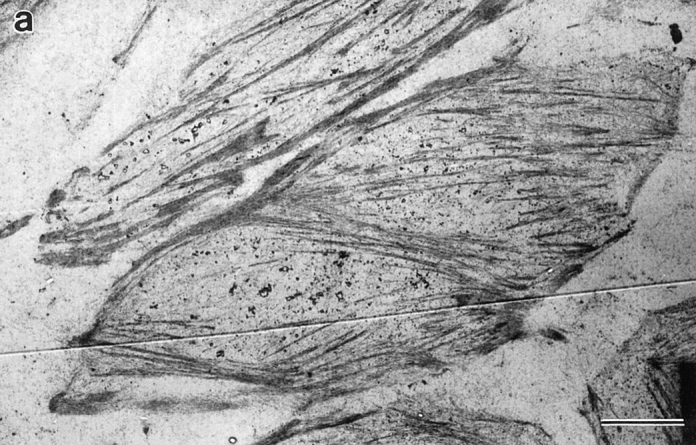
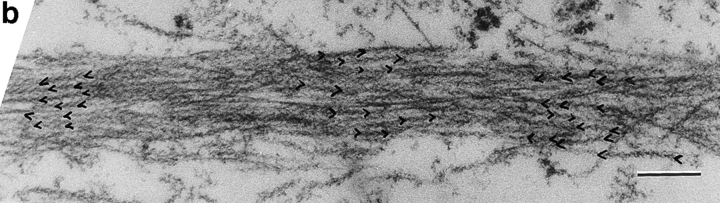
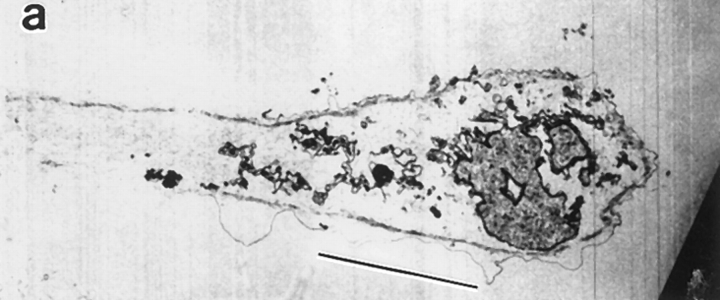
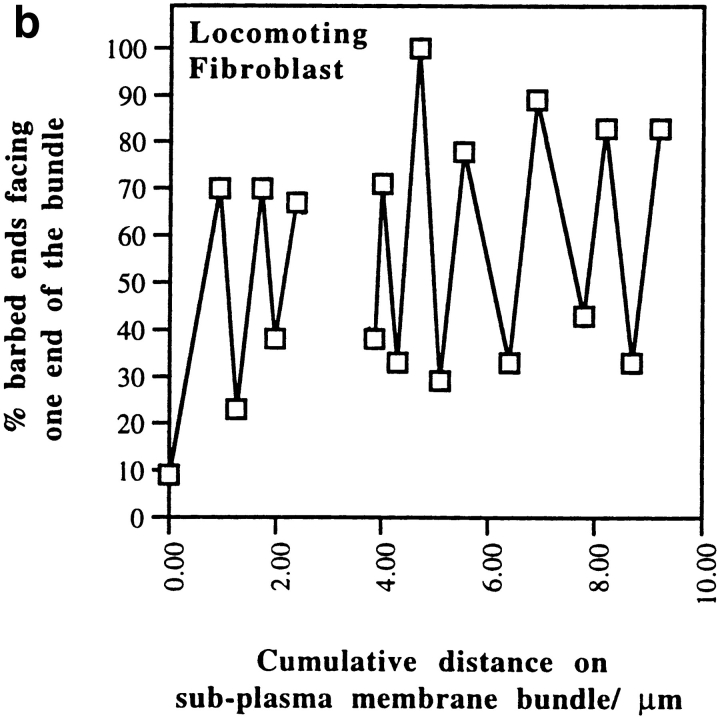
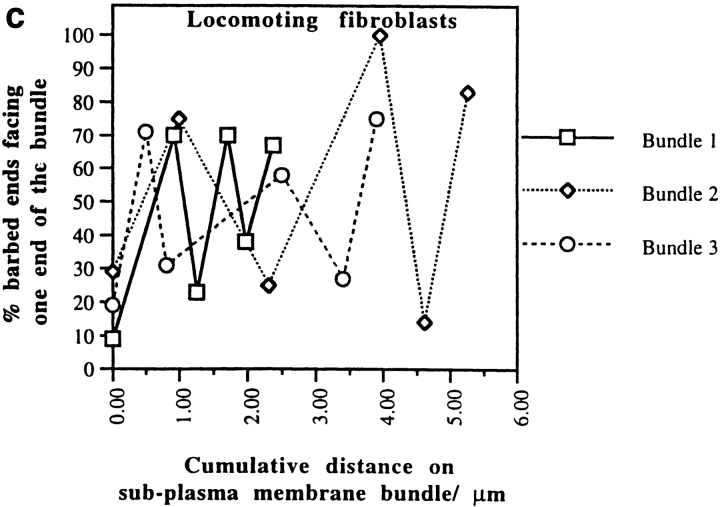
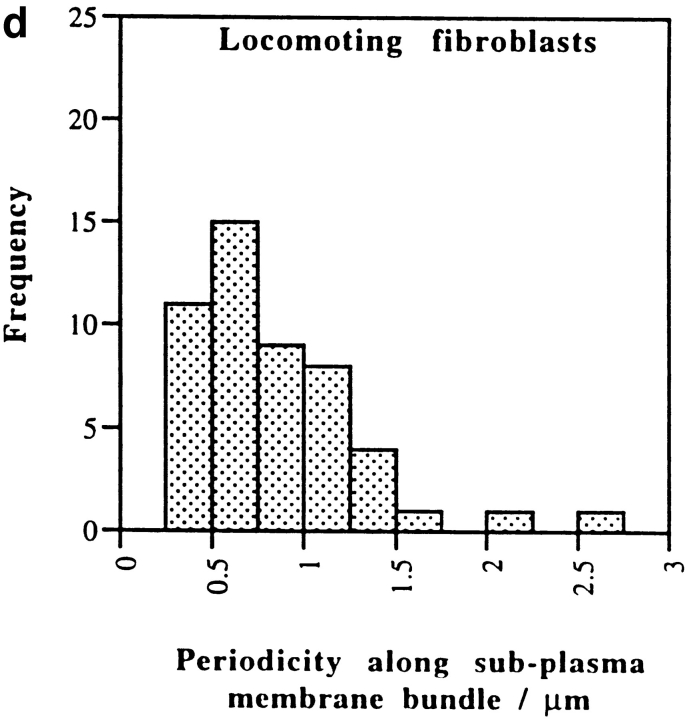
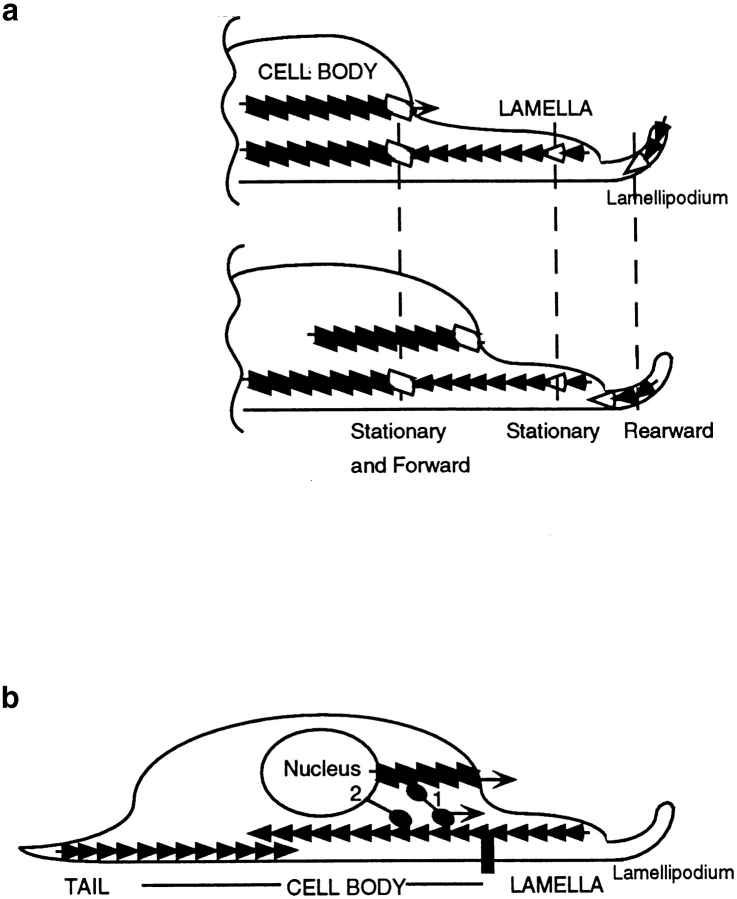
We have determined the structural organization and dynamic behavior of actin filaments in entire primary locomoting heart fibroblasts by S1 decoration, serial section EM, and photoactivation of fluorescence. As expected, actin filaments in the lamellipodium of these cells have uniform polarity with barbed ends facing forward. In the lamella, cell body, and tail there are two observable types of actin filament organization. A less abundant type is located on the inner surface of the plasma membrane and is composed of short, overlapping actin bundles (0.25-2.5 microm) that repeatedly alternate in polarity from uniform barbed ends forward to uniform pointed ends forward. This type of organization is similar to the organization we show for actin filament bundles (stress fibers) in nonlocomoting cells (PtK2 cells) and to the known organization of muscle sarcomeres. The more abundant type of actin filament organization in locomoting heart fibroblasts is mostly ventrally located and is composed of long, overlapping bundles (average 13 microm, but can reach up to about 30 microm) which span the length of the cell. This more abundant type has a novel graded polarity organization. In each actin bundle, polarity gradually changes along the length of the bundle. Actual actin filament polarity at any given point in the bundle is determined by position in the cell; the closer to the front of the cell the more barbed ends of actin filaments face forward. By photoactivation marking in locomoting heart fibroblasts, as expected in the lamellipodium, actin filaments flow rearward with respect to substrate. In the lamella, all marked and observed actin filaments remain stationary with respect to substrate as the fibroblast locomotes. In the cell body of locomoting fibroblasts there are two dynamic populations of actin filaments: one remains stationary and the other moves forward with respect to substrate at the rate of the cell body. This is the first time that the structural organization and dynamics of actin filaments have been determined in an entire locomoting cell. The organization, dynamics, and relative abundance of graded polarity actin filament bundles have important implications for the generation of motile force during primary heart fibroblast locomotion.


Figures

Figure 1
Figure 1
Locomotion analysis of chick heart fibroblasts and spatial orientation of actin filament bundles in the same cells. (a) Diagram of different cell regions and cell locations, in a locomoting cell, which we refer to in this paper (top diagram is a top view and bottom diagram a sideways view). For serial section EM the cells were cut parallel to the substrate from ventral to dorsal. (b) Diagram to illustrate the different types of cell motility that occur during cell locomotion. (c) Phase image of fixed locomoting cells that had previously been filmed. Cells were fixed immediately at the end of filming. Different cell regions are shown in cell 1, a highly polarized cell: lamellipodium (arrowhead), lamella (short arrow), cell body (long arrow) comprising the organelle rich region (above the long arrow), and the nucleus (below the long arrow). In cell 2, another highly polarized cell, the anterior of the cell (long bar) is broader than the posterior of the cell (short bar). (d) Phalloidin staining in the same cells: actin filaments in a lamellipodium (arrowhead, cell 1), longitudinal actin bundles in lamellae (short arrows, cells 1, 4, 6, and 7) and the cell body (long arrows, cells 1, 2, 4, 6, and 7), and a transverse actin bundle (arrowhead, cell 2). (e) Outline of cells and cell bodies of cells imaged in c. The dot is the approximate center of the cell body. (f) Live cell position at the beginning of filming (dashed line, 0 min). Live cell position 77 min later (solid line, same as fixed image shown in c and e). The dots are the approximate center of the cell body at intervals measured between 0–77 min, and the arrowhead (upper arrowhead for cell 6) is the position of the center of the cell body at 77 min. The joined dot-to-dot-to-arrowhead in each cell is the vector of cell body motility during cell locomotion. For cells 1, 2, 4, and 6–8 this vector defines the anterior–posterior axis. Cell 6 reversed back on itself through 180°C midway through the period of observation. Cells 1, 2, 4, and 6–8 are locomoting ∼0.5 μm/min. Bar, 10 μm.
Figure 1
Figure 1
Locomotion analysis of chick heart fibroblasts and spatial orientation of actin filament bundles in the same cells. (a) Diagram of different cell regions and cell locations, in a locomoting cell, which we refer to in this paper (top diagram is a top view and bottom diagram a sideways view). For serial section EM the cells were cut parallel to the substrate from ventral to dorsal. (b) Diagram to illustrate the different types of cell motility that occur during cell locomotion. (c) Phase image of fixed locomoting cells that had previously been filmed. Cells were fixed immediately at the end of filming. Different cell regions are shown in cell 1, a highly polarized cell: lamellipodium (arrowhead), lamella (short arrow), cell body (long arrow) comprising the organelle rich region (above the long arrow), and the nucleus (below the long arrow). In cell 2, another highly polarized cell, the anterior of the cell (long bar) is broader than the posterior of the cell (short bar). (d) Phalloidin staining in the same cells: actin filaments in a lamellipodium (arrowhead, cell 1), longitudinal actin bundles in lamellae (short arrows, cells 1, 4, 6, and 7) and the cell body (long arrows, cells 1, 2, 4, 6, and 7), and a transverse actin bundle (arrowhead, cell 2). (e) Outline of cells and cell bodies of cells imaged in c. The dot is the approximate center of the cell body. (f) Live cell position at the beginning of filming (dashed line, 0 min). Live cell position 77 min later (solid line, same as fixed image shown in c and e). The dots are the approximate center of the cell body at intervals measured between 0–77 min, and the arrowhead (upper arrowhead for cell 6) is the position of the center of the cell body at 77 min. The joined dot-to-dot-to-arrowhead in each cell is the vector of cell body motility during cell locomotion. For cells 1, 2, 4, and 6–8 this vector defines the anterior–posterior axis. Cell 6 reversed back on itself through 180°C midway through the period of observation. Cells 1, 2, 4, and 6–8 are locomoting ∼0.5 μm/min. Bar, 10 μm.
Figure 6
Figure 6
Average graded polarity of longitudinal and transverse actin filament bundles in individual locomoting chick heart fibroblasts as a function of cell position relative to the longest section of that cell. Average data for each individual cell are plotted on the same graph. (a, longitudinal actin bundles) Polarity of actin filaments in all ventral sections of individual cells. 0% is the tip of the tail, and 100% is in the lamellipodium (n = 12 cells; 742 bundle segments; 18, 905 filaments; r = 0.95). (b, transverse actin bundles) Polarity of actin filaments in ventral and middle locations across the width of cells (n = 6 cells; 141 bundle segments; 2, 354 filaments; r = 0.92).
Figure 9
Figure 9
Actin filament dynamics in the cell body, lamella, and lamellipodium of locomoting chick heart fibroblasts marked by photoactivation of fluorescence. Cells were observed by paired phase contrast epifluorescence timelapse video microscopy. Rates are generally slower than in Fig. 1 f, because photoactivation experiments were done at a lower temperature. a–f, Cell body. (a) This image of the cell does not have a classical polar morphology, but it clearly has a single lamellipodium to the right and is clearly locomoting to the right. The arrow marks the front of the cell body 13 s after photoactivation, and the vertical bar marks the location of the original mark. (b) 832 s (14 min) later the front of the cell body has moved to the right from the long arrow to a new position (short arrow) at 0.2 μm/ min. The lamellipodium (arrowhead) protruded at a net rate of 0.32 μm/min. (c) Image of marked actin in the cell body 13 s after photoactivation (long arrow). (d) 832 s later in this cell ∼50% of the total marked actin filaments move forward with respect to substrate to the right of the long arrow to the short arrow at the same rate as the cell body. The other 50% remains stationary (long arrow). (e) The separation of actin filaments into moving and stationary populations is clearly seen in the fluorescence intensity line scans (thin line, 13 s after photoactivation and thick line, 832 s [14 min] later). (f) Forward movement of actin filaments (average rate = 0.29 μm/min, SD = 0.17, n=43 cells) is tightly coupled to the rate of cell body motility in individual locomoting cells (y = x with r 2 of 0.97). g–k, Lamella. (g and h) The vertical bar marks the location of the mark in i and j, respectively. (i) Image of actin filaments marked in lamella 23 s after photoactivation (arrow). (j) 128 s later the mark has not moved (arrow). (k) Line intensity scans 23 s after photoactivation (thin line) and 128 s later (thick line). As determined from high resolution images, during this 128 s, the cell body moves 1.3 μm toward the marked actin from the thin arrow to the thick arrow. This is at least twice the distance of the widest part of the marked actin filaments, which are represented in real terms on the graph. Note that the distance between the cell body and the mark after 128 s (distance between the thick arrow and the thick line) is an actual distance of 4 μm which is not presented in real terms, because the scale of the graph is too big. l, lamellipodium. All marked and observed actin filaments flow rearward with respect to the substrate (thin line, 26 s after photoactivation and thick line, 228 s later in a fibroblast locomoting at an average 0.53 μm/min). Bars: (a–d) 10 μm; (x axis of e, k, and l) 0.65 μm.
Figure 9
Figure 9
Actin filament dynamics in the cell body, lamella, and lamellipodium of locomoting chick heart fibroblasts marked by photoactivation of fluorescence. Cells were observed by paired phase contrast epifluorescence timelapse video microscopy. Rates are generally slower than in Fig. 1 f, because photoactivation experiments were done at a lower temperature. a–f, Cell body. (a) This image of the cell does not have a classical polar morphology, but it clearly has a single lamellipodium to the right and is clearly locomoting to the right. The arrow marks the front of the cell body 13 s after photoactivation, and the vertical bar marks the location of the original mark. (b) 832 s (14 min) later the front of the cell body has moved to the right from the long arrow to a new position (short arrow) at 0.2 μm/ min. The lamellipodium (arrowhead) protruded at a net rate of 0.32 μm/min. (c) Image of marked actin in the cell body 13 s after photoactivation (long arrow). (d) 832 s later in this cell ∼50% of the total marked actin filaments move forward with respect to substrate to the right of the long arrow to the short arrow at the same rate as the cell body. The other 50% remains stationary (long arrow). (e) The separation of actin filaments into moving and stationary populations is clearly seen in the fluorescence intensity line scans (thin line, 13 s after photoactivation and thick line, 832 s [14 min] later). (f) Forward movement of actin filaments (average rate = 0.29 μm/min, SD = 0.17, n=43 cells) is tightly coupled to the rate of cell body motility in individual locomoting cells (y = x with r 2 of 0.97). g–k, Lamella. (g and h) The vertical bar marks the location of the mark in i and j, respectively. (i) Image of actin filaments marked in lamella 23 s after photoactivation (arrow). (j) 128 s later the mark has not moved (arrow). (k) Line intensity scans 23 s after photoactivation (thin line) and 128 s later (thick line). As determined from high resolution images, during this 128 s, the cell body moves 1.3 μm toward the marked actin from the thin arrow to the thick arrow. This is at least twice the distance of the widest part of the marked actin filaments, which are represented in real terms on the graph. Note that the distance between the cell body and the mark after 128 s (distance between the thick arrow and the thick line) is an actual distance of 4 μm which is not presented in real terms, because the scale of the graph is too big. l, lamellipodium. All marked and observed actin filaments flow rearward with respect to the substrate (thin line, 26 s after photoactivation and thick line, 228 s later in a fibroblast locomoting at an average 0.53 μm/min). Bars: (a–d) 10 μm; (x axis of e, k, and l) 0.65 μm.
Figure 2
Figure 2
Actomyosin bundles in fixed locomoting chick heart fibroblasts compared to stress fibers in PtK2 cells and talin staining in these two cell types. (a, fibroblast) Phalloidin staining. Note actin filament bundles (arrow). (b, same fibroblast) Anti-myosin II staining. The same bundles costain for myosin II (arrow). (c, fibroblast) Myosin II staining. Actin bundles in locomoting fibroblasts show an irregular punctate pattern from one bundle (e.g., top end of the vertical lines) to another (e.g., arrowhead). (d, PtK2 cell) Myosin II staining. All stress fibers are stained in a regular punctate pattern (bottom end of the vertical lines and arrowhead). (e) Anti-talin staining in a locomoting heart fibroblast is in thin streaks in the whole cell. (f) Anti-talin staining in a PtK2 cell is predominantly in thick streaks at the cell periphery. Bar: (a, b, e, and f) 10 μm; (c and d) 4 μm.
Figure 3
Figure 3
Ultrastructural organization of actin filament bundles in locomoting chick heart fibroblasts. Cells were fixed for optimal actin filament preservation. Micrographs of longitudinal (a–e), transverse (g), and subplasma membrane actin bundles (d and f) are from different cells. All images are presented with the anterior of the cell to the right. (a, ventral surface) Longitudinal actin bundles carpet the entire surface of the cell body and lamella (between the long arrows) and are found in the tail (short arrow). These bundles correspond to those visualized by phalloidin staining (Fig. 1 d, long and short arrows and Fig. 2 a, arrow). (b, middle section toward the bottom of the nucleus) The lamellipodium is just visible (long arrow). Longitudinal actin bundles are observable in the tail (short arrows) and in the cell body are associated with the bottom of the nucleus (arrowheads). (c) Association of longitudinal actin bundles (arrowheads) with the nucleus (arrow) at higher magnification. (d, dorsal region toward the top of the nucleus) Longitudinal actin bundles (long arrow) also appear in close apposition to the nucleus (arrowheads). (e, dorsal surface) Longitudinal actin bundles are shorter (arrow). (f, subplasma membrane actin bundle) An actin bundle (arrow) at higher magnification underneath the plasma membrane (arrowhead) at a side cell margin. For orientation a low magnification view of an actin bundle (short arrow) underneath the plasma membrane (double arrowhead) is shown in d. (g, transverse actin bundles) Transverse actin bundles in the lamella (long arrow) and in a more posterior location (short arrow). (h) Organization of posterior transverse actin bundles (short arrows) shown in g is clearer at higher magnification; the long arrow indicates the vector of locomotion. Bar: (a, b, d, and e) 2 μm; (c, f, and h) 0.4 μm; (g) 9 μm.
Figure 4
Figure 4
Polarity of actin filaments in longitudinal actin bundles in extreme cell locations of locomoting chick heart fibroblasts using S1 decoration. Examples of polarity from different cells are highlighted with ink traces of the chevrons. The vector of locomotion in a–c is to the right (arrow). c was spliced together. (a, anterior of the lamella) The barbed ends of actin filaments face forward. (b, approximate cell center) Actin bundles have mixed polarity. (c, tip of the tail) The pointed ends of actin filaments face forward. (d) Polarity is quantitated at regular intervals along each of three representative longitudinal actin bundles located in the anterior of the lamella, approximate cell center, and tip of tail, respectively. Bar (shaft of arrow in c), 0.2 μm.
Figure 4
Figure 4
Polarity of actin filaments in longitudinal actin bundles in extreme cell locations of locomoting chick heart fibroblasts using S1 decoration. Examples of polarity from different cells are highlighted with ink traces of the chevrons. The vector of locomotion in a–c is to the right (arrow). c was spliced together. (a, anterior of the lamella) The barbed ends of actin filaments face forward. (b, approximate cell center) Actin bundles have mixed polarity. (c, tip of the tail) The pointed ends of actin filaments face forward. (d) Polarity is quantitated at regular intervals along each of three representative longitudinal actin bundles located in the anterior of the lamella, approximate cell center, and tip of tail, respectively. Bar (shaft of arrow in c), 0.2 μm.
Figure 5
Figure 5
Graded polarity in individual actin bundles at the ventral surface and in a middle section of the same locomoting chick heart fibroblast. In these sections individual actin bundles appear to be very long (up to ∼30 μm) and to consecutively span the length of the section. Polarity was measured every 0.5 μm over the length of each section. (a, ventral surface) Polarity was measured for the continuous, colinear actin bundles joined by the arrows from the tip of the tail to the anterior of the lamella or the back of the lamellipodium. (b, ventral section) Polarity for the actin bundles indicated in a as a function of bundle position relative to the position of the tip of the tail in the middle section (since the middle section was longer). (c, middle section) Polarity was measured for the continuous, colinear actin bundles joined by the arrows from the tip of the tail to the front of the lamellipodium. (d, middle section) Polarity for the actin bundles indicated in c as a function of bundle position relative to the tip of the tail. Bar, 6.6 μm.
Figure 5
Figure 5
Graded polarity in individual actin bundles at the ventral surface and in a middle section of the same locomoting chick heart fibroblast. In these sections individual actin bundles appear to be very long (up to ∼30 μm) and to consecutively span the length of the section. Polarity was measured every 0.5 μm over the length of each section. (a, ventral surface) Polarity was measured for the continuous, colinear actin bundles joined by the arrows from the tip of the tail to the anterior of the lamella or the back of the lamellipodium. (b, ventral section) Polarity for the actin bundles indicated in a as a function of bundle position relative to the position of the tip of the tail in the middle section (since the middle section was longer). (c, middle section) Polarity was measured for the continuous, colinear actin bundles joined by the arrows from the tip of the tail to the front of the lamellipodium. (d, middle section) Polarity for the actin bundles indicated in c as a function of bundle position relative to the tip of the tail. Bar, 6.6 μm.
Figure 7
Figure 7
Alternating polarity of stress fibers in PtK2 cells. (a) Micrograph of stress fibers at low magnification. (b) A segment of one stress fiber. Alternating polarity is indicated with ink traces of the chevrons. (c) Polarity alternates at short regular intervals in individual stress fibers from three different PtK2 cells (normalized to 0 μm; n = 5 cells, 37 stress fiber segments, 2, 654 filaments). (d) Histogram of each switch in polarity (periodicity) in stress fibers in the entire PtK2 cell population (average periodicity is 0.6 μm, n = 50, SD = 0.2). Bars: (a) 8.5 μm; (b) 0.2 μm.
Figure 7
Figure 7
Alternating polarity of stress fibers in PtK2 cells. (a) Micrograph of stress fibers at low magnification. (b) A segment of one stress fiber. Alternating polarity is indicated with ink traces of the chevrons. (c) Polarity alternates at short regular intervals in individual stress fibers from three different PtK2 cells (normalized to 0 μm; n = 5 cells, 37 stress fiber segments, 2, 654 filaments). (d) Histogram of each switch in polarity (periodicity) in stress fibers in the entire PtK2 cell population (average periodicity is 0.6 μm, n = 50, SD = 0.2). Bars: (a) 8.5 μm; (b) 0.2 μm.
Figure 8
Figure 8
Alternating polarity of subplasma membrane actin filament actin bundles in locomoting chick heart fibroblasts. (a) A micrograph of a middle section at low magnification. The bar indicates a stretch of an actin bundle under the plasma membrane. (b) In the actin bundle shown in a, polarity alternates at short irregular intervals. (c) Polarity alternates at irregular intervals in individual subplasma membrane actin bundles from three different fibroblasts (normalized to 0 μm). (d) Histogram of each switch in periodicity in subplasma membrane actin bundles in the entire fibroblast cell population (average periodicity is 0.8 μm, n = 50, SD = 0.6). Bar, 10 μm.
Figure 8
Figure 8
Alternating polarity of subplasma membrane actin filament actin bundles in locomoting chick heart fibroblasts. (a) A micrograph of a middle section at low magnification. The bar indicates a stretch of an actin bundle under the plasma membrane. (b) In the actin bundle shown in a, polarity alternates at short irregular intervals. (c) Polarity alternates at irregular intervals in individual subplasma membrane actin bundles from three different fibroblasts (normalized to 0 μm). (d) Histogram of each switch in periodicity in subplasma membrane actin bundles in the entire fibroblast cell population (average periodicity is 0.8 μm, n = 50, SD = 0.6). Bar, 10 μm.
Figure 10
Figure 10
Model for the generation of motile force for forward motility of the cell body during heart fibroblast locomotion. (a) Observed dynamic behavior and polarity of actin filaments in locomoting fibroblasts. Actin filaments (rows of consecutive solid parallelograms and triangles) are marked with zones of fluorescence (open parallelograms and triangles). Actin filament polarity (in a and b) is simplified. Barbed ends are the broad ends of triangles (e.g. in a this is to the right). Polarity is not represented for parallelograms. In the cell body in graded polarity actin bundles (parallelograms) we do not know the spatial location of the forward moving and stationary actin filament populations. We suspect that on the ventral surface of the cell body, a proportion of or all filaments in graded polarity actin bundles are stationary, because this is the behavior of all the filaments in the lamella, and graded polarity actin bundles in the lamella (triangles) are continuous with those in the cell body (e.g., Fig. 3, a and b, and Fig. 5, a and b). In the lamellipodium, actin filaments have uniform polarity and flow rearward with respect to substrate. (b) We suggest that (1) in graded polarity actin bundles myosin (two balls and one stick) moving in the direction of (lower arrow) the barbed end of a population of stationary actin filaments (row of triangles attached to substrate by a vertical black bar) pulls a second population of actin filaments (row of parallelograms) forward, and this drives the cell body forward (upper arrow). (2) Myosin (one ball and stick) may also directly move the nucleus forward. Both mechanisms 1 and 2 may exist in cells.

References

    1. Abercrombie M. The crawling movements of metazoan cells. Proc R Soc Lond Ser B. 1980;207:129–147.
    1. Abercrombie M, Heaysman JE, Pegrum SM. The locomotion of fibroblasts in culture. II “Ruffling”. Exp Cell Res. 1970;60:437–444. - PubMed
    1. Begg DA, Rodewald R, Rebhun LI. The visualization of actin filament polarity in thin sections. J Cell Biol. 1978;79:846–852. - PMC - PubMed
    1. Boyles J, Anderson L, Hutcherson P. A new fixative for the preservation of actin filaments: fixation of pure actin filament pellets. J Histochem Cytochem. 1985;33:1116–1128. - PubMed
    1. Bretscher A. Fimbrin is a cytoskeletal protein that crosslinks F-actin in vitro. Proc Natl Acad Sci USA. 1981;78:6849–6853. - PMC - PubMed

Publication types