

Dose-response cocaine pharmacokinetics and metabolite profile following intravenous administration and arterial sampling in unanesthetized, freely moving male rats
- PMID: 9088006
- PMCID: PMC4041984
- DOI: 10.1016/s0892-0362(96)00180-8
Dose-response cocaine pharmacokinetics and metabolite profile following intravenous administration and arterial sampling in unanesthetized, freely moving male rats
Abstract
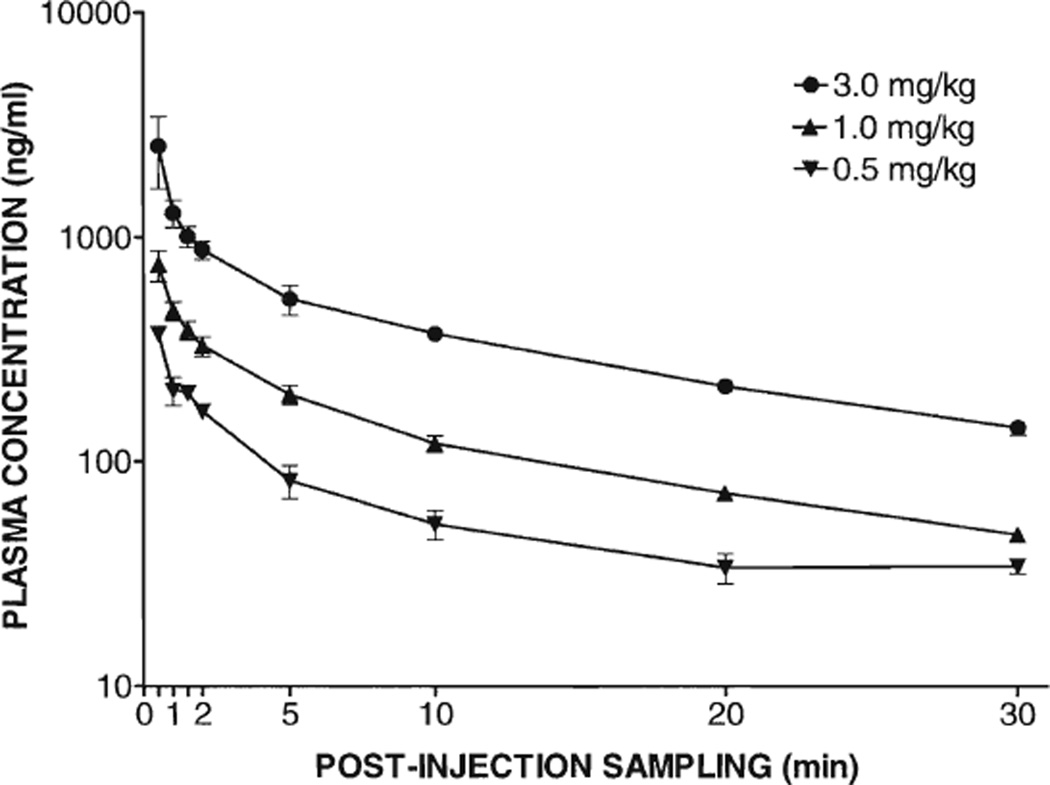
Despite the wealth of experimental data on cocaine abuse, there are no published dose-response pharmacokinetic studies with bolus i.v. cocaine injection in the male rat. The present study examined the pharmacokinetics of arterial plasma concentrations of cocaine and metabolite profile [benzoylecgonine (BE), ecgonine methyl ester (EME), norcocaine (NC)] following a single i.v. injection of 0.5, 1.0, or 3.0 mg/kg cocaine. Male Sprague-Dawley rats (N = 25) were anesthetized and surgically instrumented with both jugular vein (drug administration) and carotid artery (blood withdrawal) catheters and allowed to recover for at least 24 h. Arterial plasma samples (200 microliters) were obtained at eight time points (0.5, 1.5, 2.5, 10, 20, 30 min) following i.v. bolus injection (15-s injection, 15-s flush) and analyzed by single ion monitoring using GC/MS. Nonlinear regression and noncompartmental pharmacokinetic analysis were employed. Mean +/- SEM peak plasma concentrations of cocaine occurred at 30 s in a dose-response manner (370 +/- 14,755 +/- 119,2553 +/- 898 ng/ml for 0.5, 1.0, and 3.0 mg/kg groups, respectively). T1/2 alpha was < 1 min for all groups, but inversely related to dose. T1/2 beta was independent of dose 13.3 +/- 1.6, 13.0 +/- 1.5, and 12.0 +/- 2.0 min for 0.5, 1.0, and 3.0 mg/kg groups, respectively). MRT (16.0, 15.9, 14.5 min), VdSS (3.3, 3.2, and 2.8 l/kg), and ClTOT (204, 201, and 195 ml/min/kg) also provided little evidence of dose-dependent effects. Although the metabolic profile of i.v. cocaine was similarly ordered for all dose groups (BE > EME > NC), a quantitative shift in metabolite profile was evident as a function of increasing dose. This metabolic shift, perhaps attributable to saturation of plasma and liver esterases, suggests that the recently reported pharmacodynamic effects positively correlated with i.v. cocaine dose are unlikely attributable to NC, a minor but pharmacologically active metabolite. In sum, the i.v. pharmacokinetic profile in rats is distinct from that observed via the SC, IP, and PO routes of administration and offers the potential to provide a reasonable clinically relevant rodent model.
Figures


References
-
- Apple FS, Roe SJ. Cocaine-associated fetal death in utero. J. Anal. Toxicol. 1990;14:259–260. - PubMed
-
- Barbieri EJ, Ferko AP, DiGregorio GJ, Ruch EK. The presence of cocaine and benzoylecgonine in rat cerebrospinal fluid after the intravenous administration of cocaine. Life Sci. 1992;51:1739–1746. - PubMed
-
- Barnett G, Hawks R, Resnick R. Cocaine pharmacokinetics in humans. J. Ethnopharmacol. 1981;3:353–366. - PubMed
-
- Benet LZ, Kroetz DL, Sheiner LB. Pharmacokinetics. The dynamics of drug absorption, distribution, and elimination. In: Hardman JG, Limbird LE, Molinoff PB, Ruddon RW, editors. The pharmacological basis of therapeutics. 9th ed. New York: McGraw-Hill; 1996. pp. 21–22.
-
- Boni JP, Barr WH, Martin BR. Cocaine inhalation in the rat: Pharmacokinetics and cardiovascular response. J. Pharmacol. Exp. Ther. 1991;257:307–315. - PubMed
Publication types
MeSH terms
Substances
Grants and funding
LinkOut - more resources
Full Text Sources
Other Literature Sources
Miscellaneous
