. 1997 Mar;109(3):289-99.
doi: 10.1085/jgp.109.3.289.

Locating the anion-selectivity filter of the cystic fibrosis transmembrane conductance regulator (CFTR) chloride channel

Affiliations

Locating the anion-selectivity filter of the cystic fibrosis transmembrane conductance regulator (CFTR) chloride channel

M Cheung et al. J Gen Physiol. 1997 Mar.

Abstract

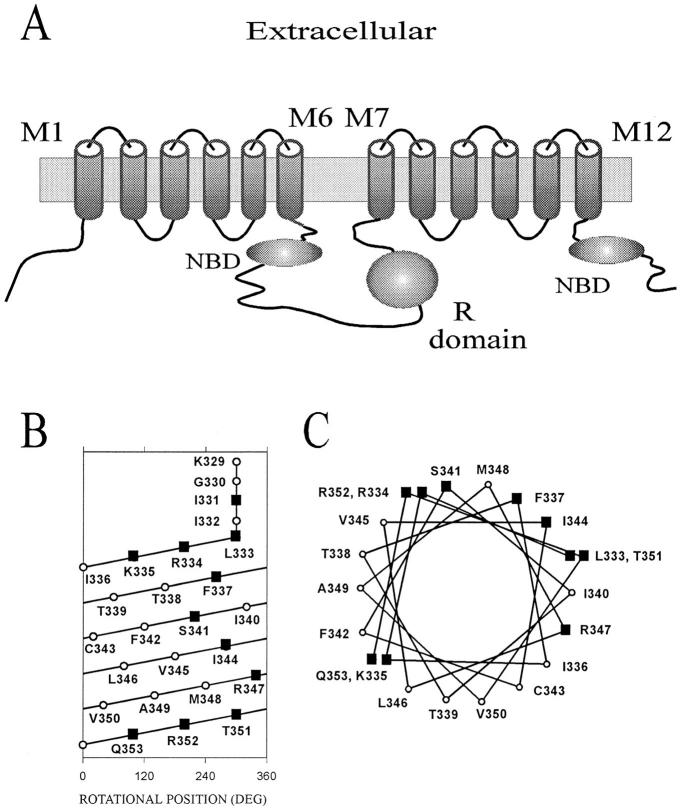
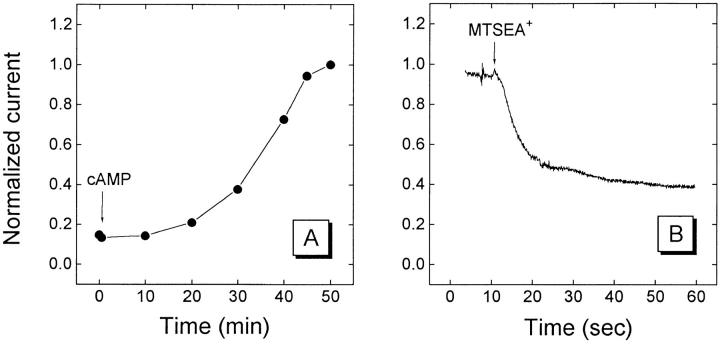
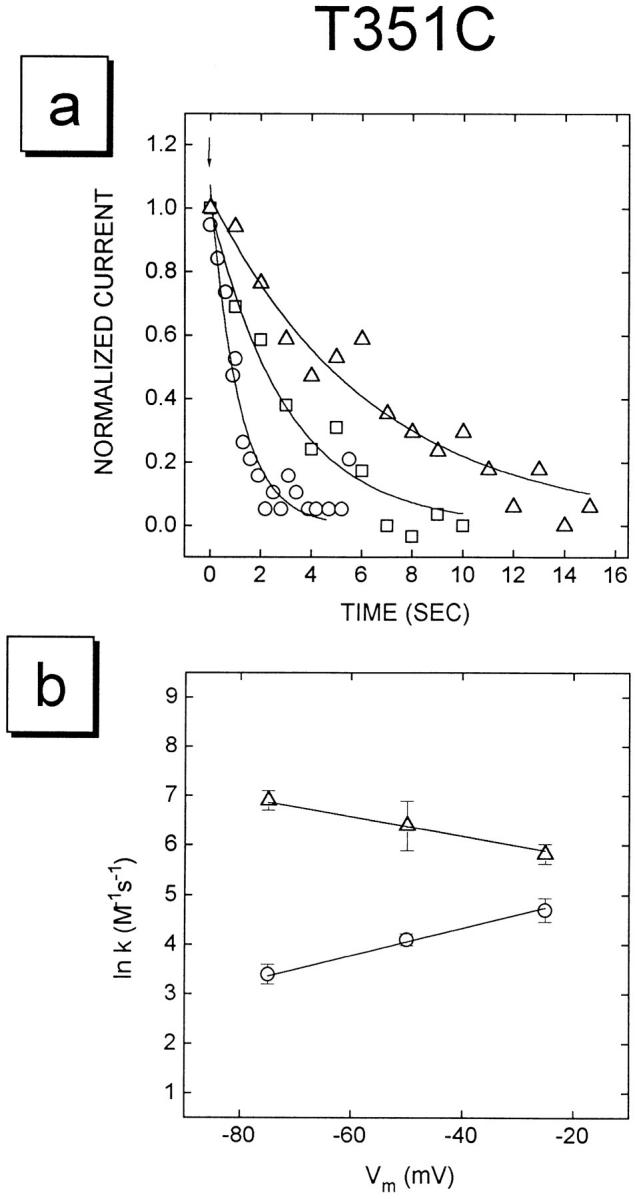
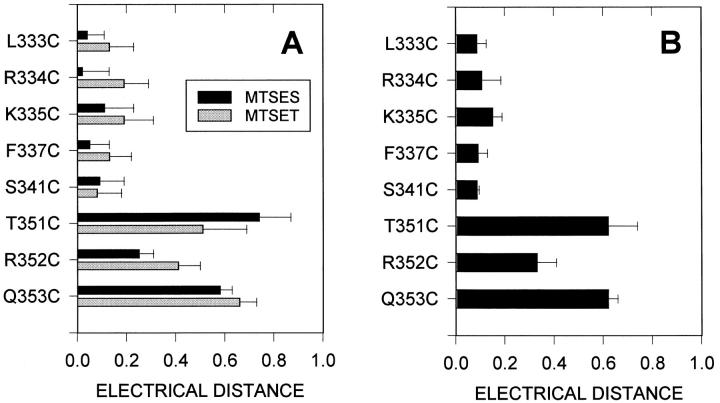
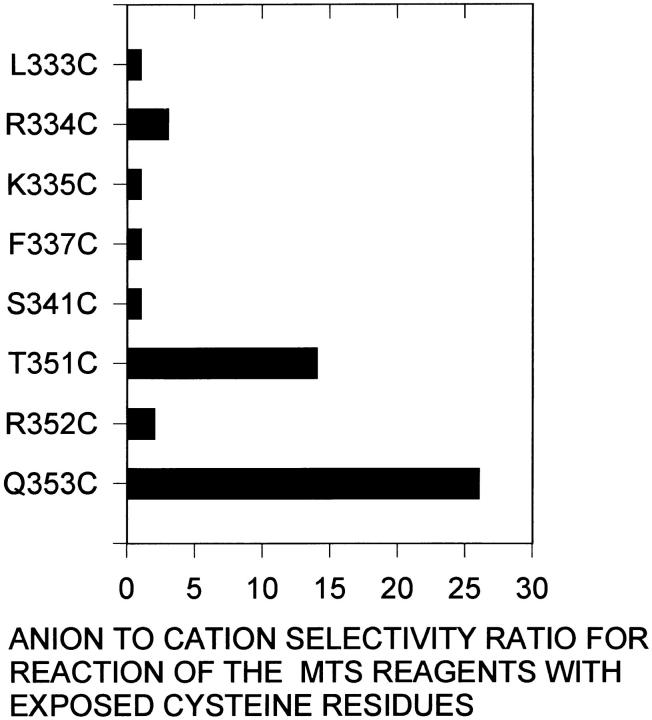
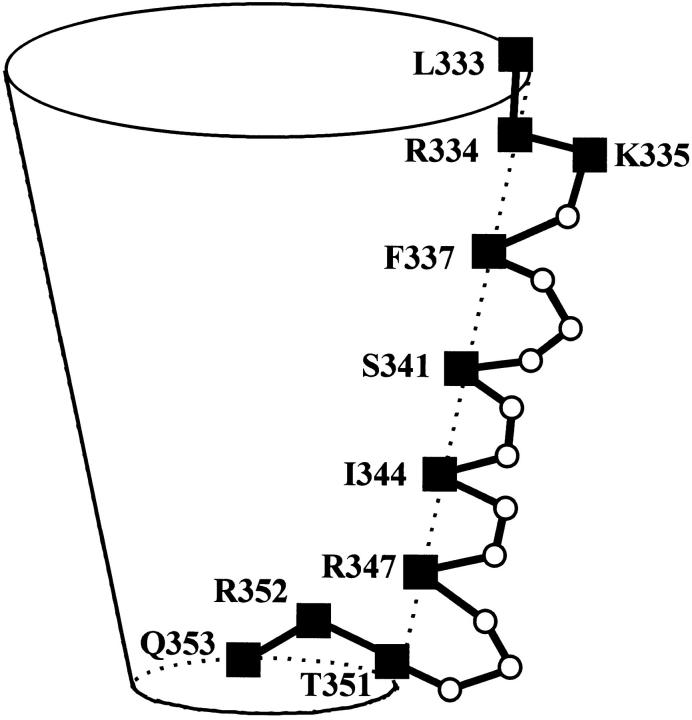
The cystic fibrosis transmembrane conductance regulator forms an anion-selective channel; the site and mechanism of charge selectivity is unknown. We previously reported that cysteines substituted, one at a time, for Ile331, Leu333, Arg334, Lys335, Phe337, Ser341, Ile344, Arg347, Thr351, Arg352, and Gln353, in and flanking the sixth membrane-spanning segment (M6), reacted with charged, sulfhydryl-specific, methanethiosulfonate (MTS) reagents. We inferred that these residues are on the water-accessible surface of the protein and may line the ion channel. We have now measured the voltage-dependence of the reaction rates of the MTS reagents with the accessible, engineering cysteines. By comparing the reaction rates of negatively and positively charged MTS reagents with these cysteines, we measured the extent of anion selectivity from the extracellular end of the channel to eight of the accessible residues. We show that the major site determining anion vs. cation selectivity is near the cytoplasmic end of the channel; it favors anions by approximately 25-fold and may involve the residues Arg347 and Arg 352. From the voltage dependence of the reaction rates, we calculated the electrical distance to the accessible residues. For the residues from Leu333 to Ser341 the electrical distance is not significantly different than zero; it is significantly different than zero for the residues Thr351 to Gln353. The maximum electrical distance measured was 0.6 suggesting that the channel extends more cytoplasmically and may include residues flanking the cytoplasmic end of the M6 segment. Furthermore, the electrical distance calculations indicate that R352C is closer to the extracellular end of the channel than either of the adjacent residues. We speculate that the cytoplasmic end of the M6 segment may loop back into the channel narrowing the lumen and thereby forming both the major resistance to current flow and the anion-selectivity filter.


Figures

Figure 1
Figure 1
Predicted transmembrane topology of CFTR and α-helical representations of the MTS accessible residues in and flanking the M6 membrane-spanning segment. (A) The predicted transmembrane topology of CFTR (Riordan et al., 1989). NBD, nucleotide binding domain. (B) α-Helical net representation of the residues in and flanking the M6 membrane-spanning segment. The extracellular end is at the top, the intracellular end is at the bottom. The x-axis represents position on the circumference of the helix. Residues that are aligned vertically are on the same face of the helix. The residues Lys329 to Ile332 are not drawn as part of the helix to indicate that they are likely to be in the loop connecting the M5 and M6 segments. Based on the original hydrophobicity analysis the M6 segment included residues Gly330 to Val350 (Riordan et al., 1989). (C) α-Helical wheel representation of the residues in and flanking the M6 membrane-spanning segment. In B and C black squares indicate residues that are accessible to the MTS reagents, and open circles indicate residues that were unaffected by the MTS reagents (Cheung and Akabas, 1996).
Figure 2
Figure 2
Activation of T351C mutant and effect of MTSEA+. (A) Illustration of the activation of the CFTR-induced current in an oocyte expressing the T351C mutant under two-electrode voltage clamp. At the arrow marked cAMP the cAMP-activating solution was perfused into the bath. The currents are normalized by the final value 3,281 nA. (B) Continuous recording of current response from oocyte before and after the addition of 1.25 mM MTSEA+ in the cAMP-activating solution to the bath. Currents were recorded from the same oocyte as in A. Holding potential −25 mV.
Figure 3
Figure 3
Experiments illustrating data used to determine rates of reaction of the MTS reagents with the T351C mutant. (A) The currents following the addition of 5 mM MTSES to three oocytes voltage clamped at −25 (open circles), −50 (open squares), and −75 mV (open triangles) are shown. At the downward arrow MTSES was added. The open symbols are a subset of the digitized data points. The solid lines were determined by fitting single exponential decay functions to the experimental data. The currents have been normalized to the initial values. (B) The natural log of the rate constants, k, for MTSES (circles) and MTSET+ (triangles) reacting with the T351C mutant are plotted as a function of voltage. Solid lines show the linear regression fits to the data points. Note that, as expected, the rate of reaction of the anionic reagent decreases and the rate of reaction of the cationic reagent increases with more negative voltage.
Figure 4
Figure 4
Electrical distance from the extracellular end of the channel to the water exposed residues in the M6 membrane-spanning segment. (A) The electrical distance calculated from the voltage dependence of the reaction of MTSES (black bars) and  MTSET (gray bars) with  water- accessible cysteine residues. (B) The average electrical distance to the water exposed residues in the M6 segment. The distance from the extracellular end to T351C and Q353C is significantly greater than to the other residues (P < 0.05).
Figure 5
Figure 5
Anion to cation selectivity ratio determined from the relative rates of reaction of MTSES and MTSET+ with the water exposed residues in the M6 segment. The anion selectivity ratio is calculated as described in Table II, column 5. Note the marked increase in anion selectivity at the residues T351C and Q353C. A ratio of 1 indicates no selectivity between anions and cations. The larger the ratio the greater the anion selectivity.
Figure 6
Figure 6
A cartoon of the CFTR channel illustrating the M6 segment residues lining part of the channel wall. The residues at the cytoplasmic end of the M6 segment loop back into the channel; this narrows the lumen and forms the anion-selectivity filter. Black squares indicate MTS accessible residues, open circles indicate MTS inaccessible residues.

References

    1. Akabas MH, Kaufmann C, Archdeacon P, Karlin A. Identification of acetylcholine receptor channel-lining residues in the entire M2 segment of the α subunit. Neuron. 1994a;13:919–927. - PubMed
    1. Akabas MH, Kaufmann C, Cook TA, Archdeacon P. Amino acid residues lining the chloride channel of the cystic fibrosis transmembrane conductance regulator. J Biol Chem. 1994b;269:14865–14868. - PubMed
    1. Akabas MH, Stauffer DA, Xu M, Karlin A. Acetylcholine receptor channel structure probed in cysteine-substitution mutants. Science (Wash DC) 1992;258:307–310. - PubMed
    1. Anderson MP, Berger HA, Rich DP, Gregory RJ, Smith AE, Welsh MJ. Nucleotide triphosphates are required to open the CFTR chloride channel. Cell. 1991a;67:775–784. - PubMed
    1. Anderson MP, Gregory RJ, Thompson S, Souza DW, Paul S, Mulligan RC, Smith AE, Welsh MJ. Demonstration that CFTR is a chloride channel by alteration of its anion selectivity. Science (Wash DC) 1991b;253:202–205. - PubMed

Publication types