. 1997 Mar;109(3):327-43.
doi: 10.1085/jgp.109.3.327.

Contribution of sialic acid to the voltage dependence of sodium channel gating. A possible electrostatic mechanism

Affiliations

Contribution of sialic acid to the voltage dependence of sodium channel gating. A possible electrostatic mechanism

E Bennett et al. J Gen Physiol. 1997 Mar.

Abstract

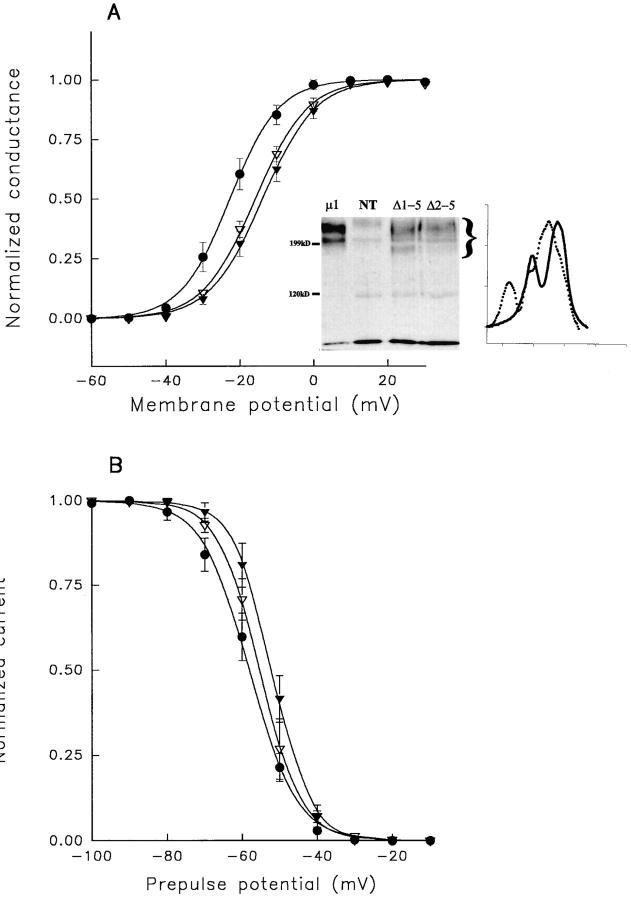
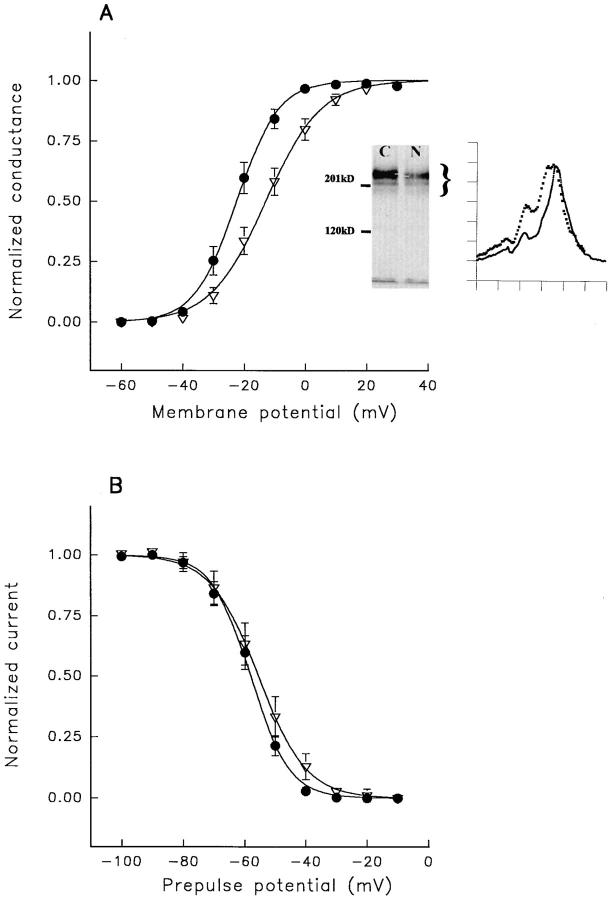
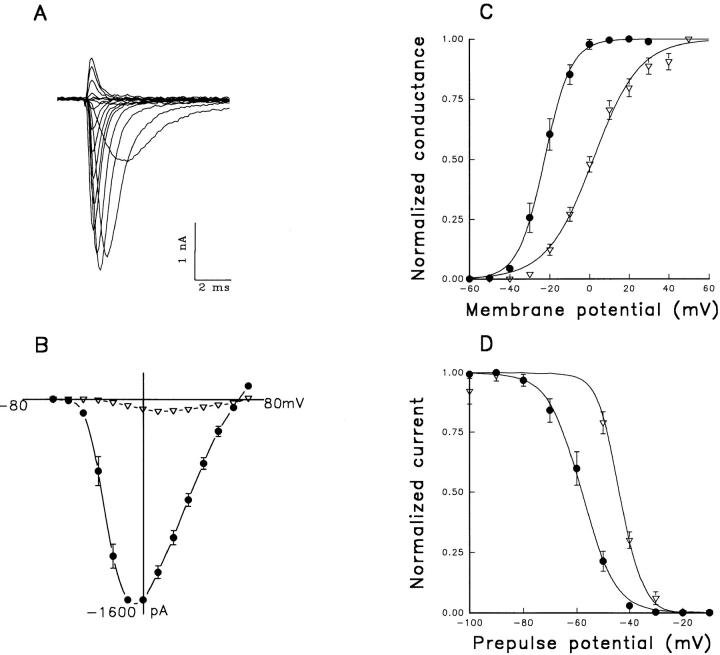
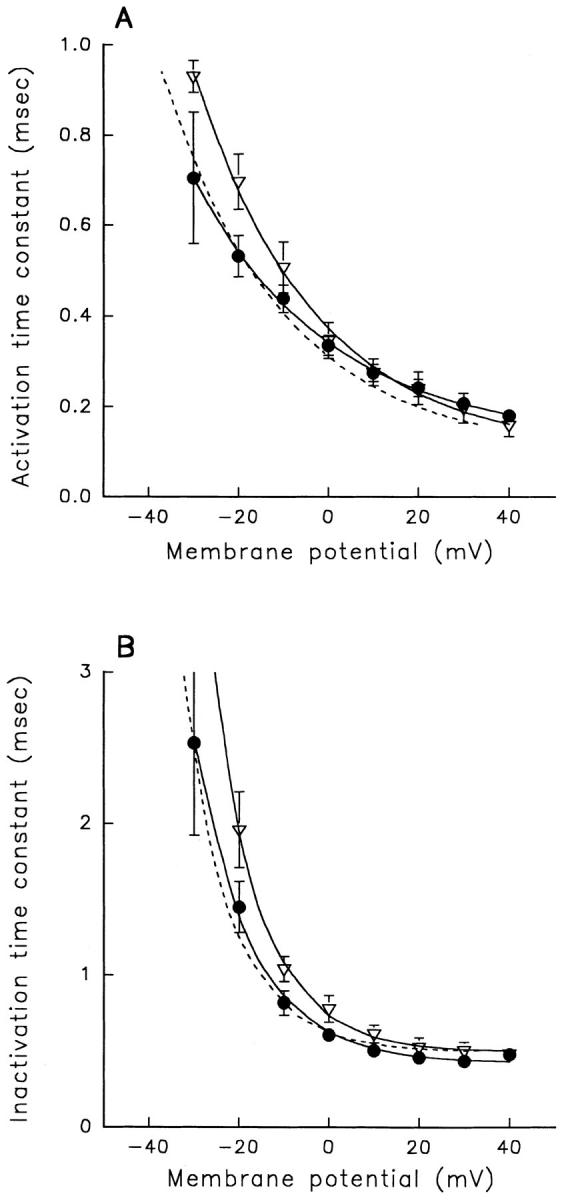
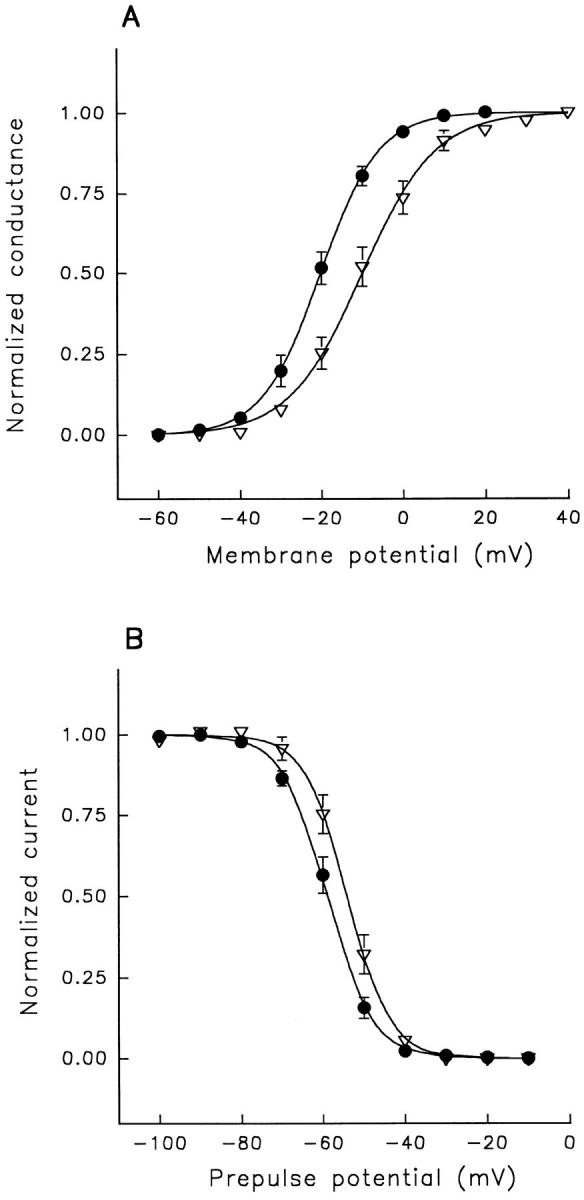
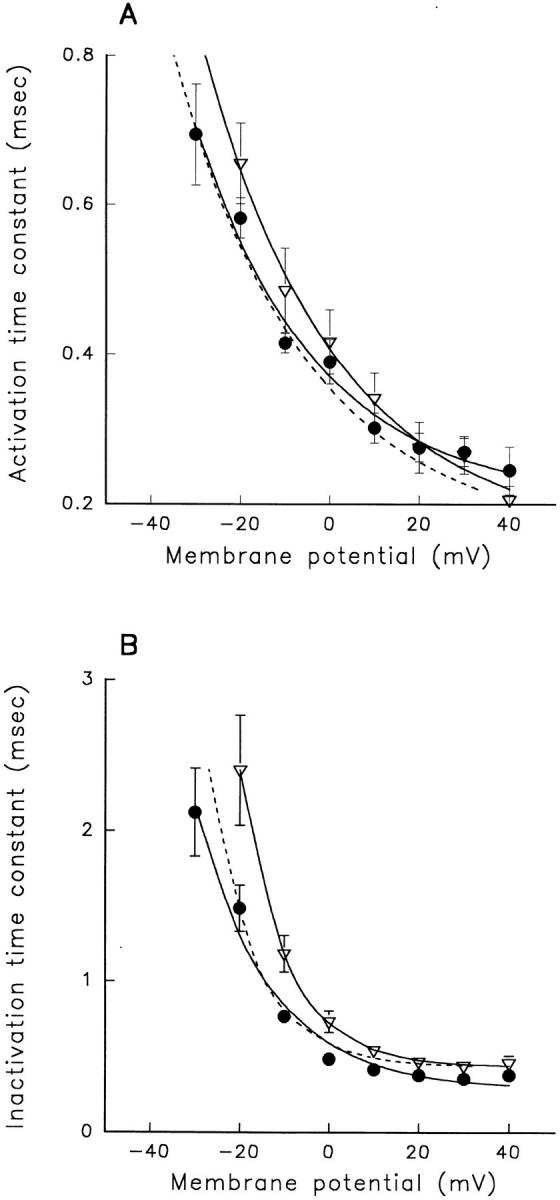
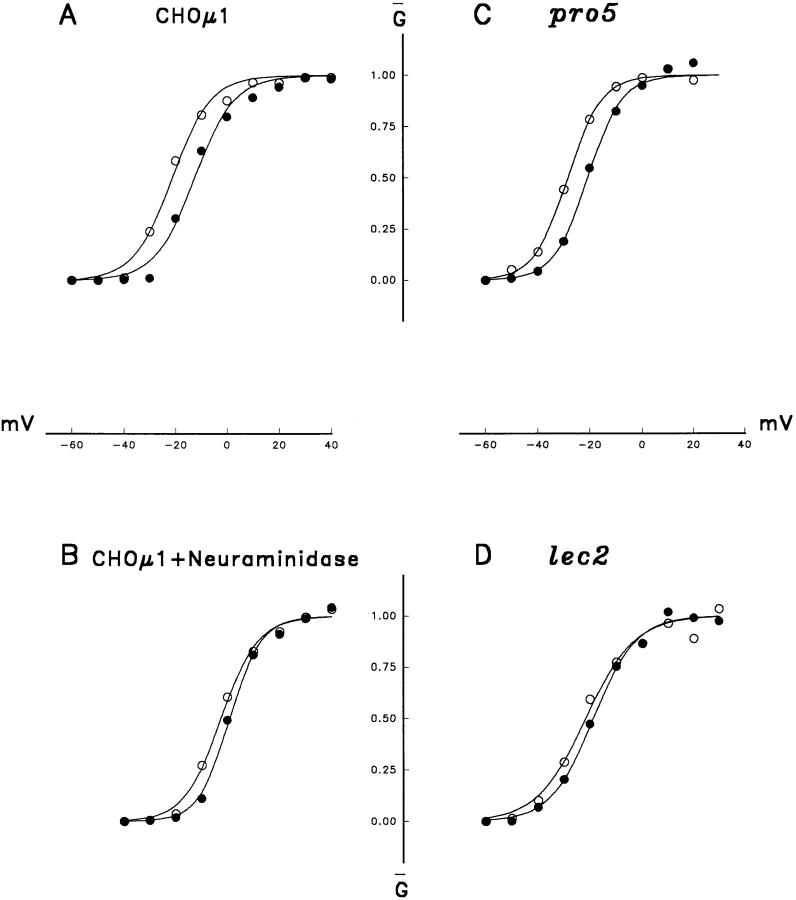
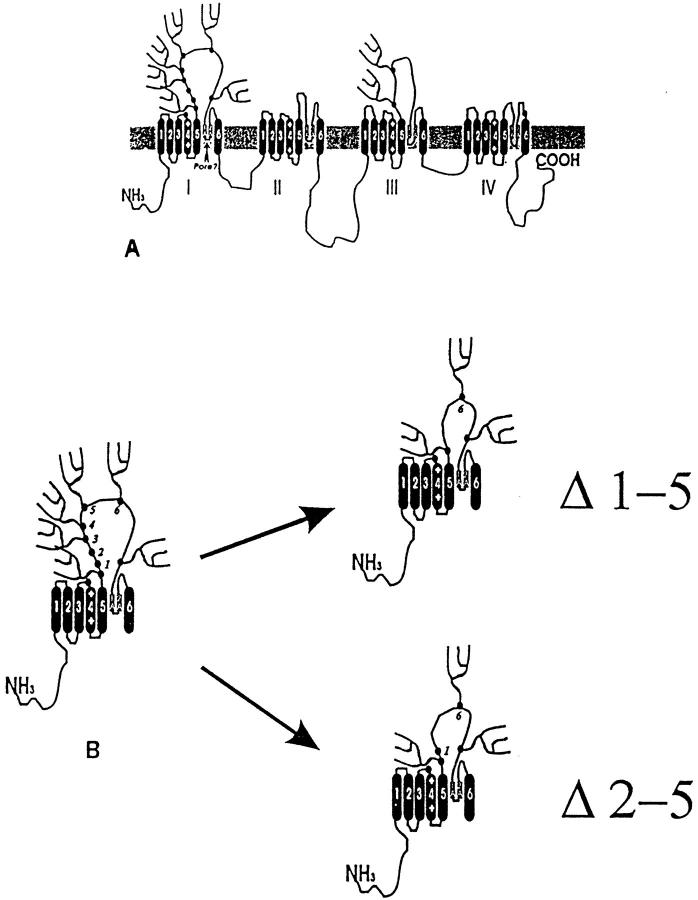
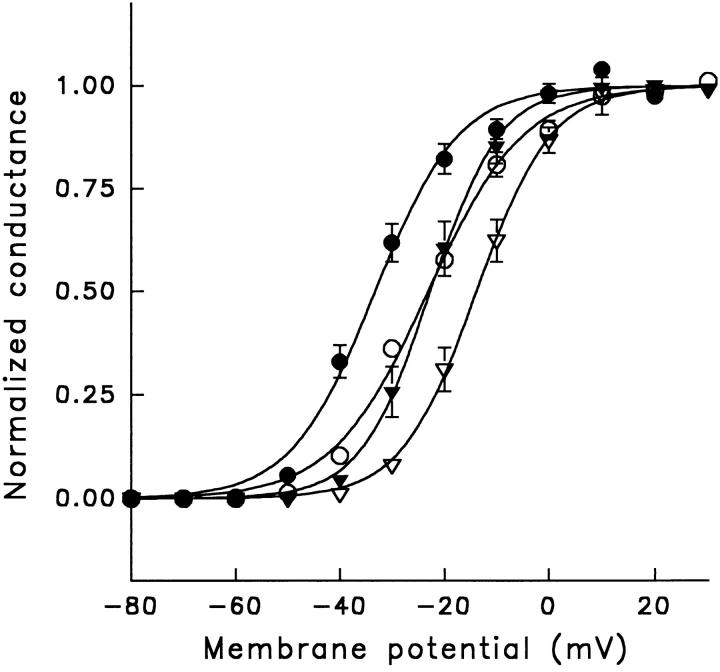
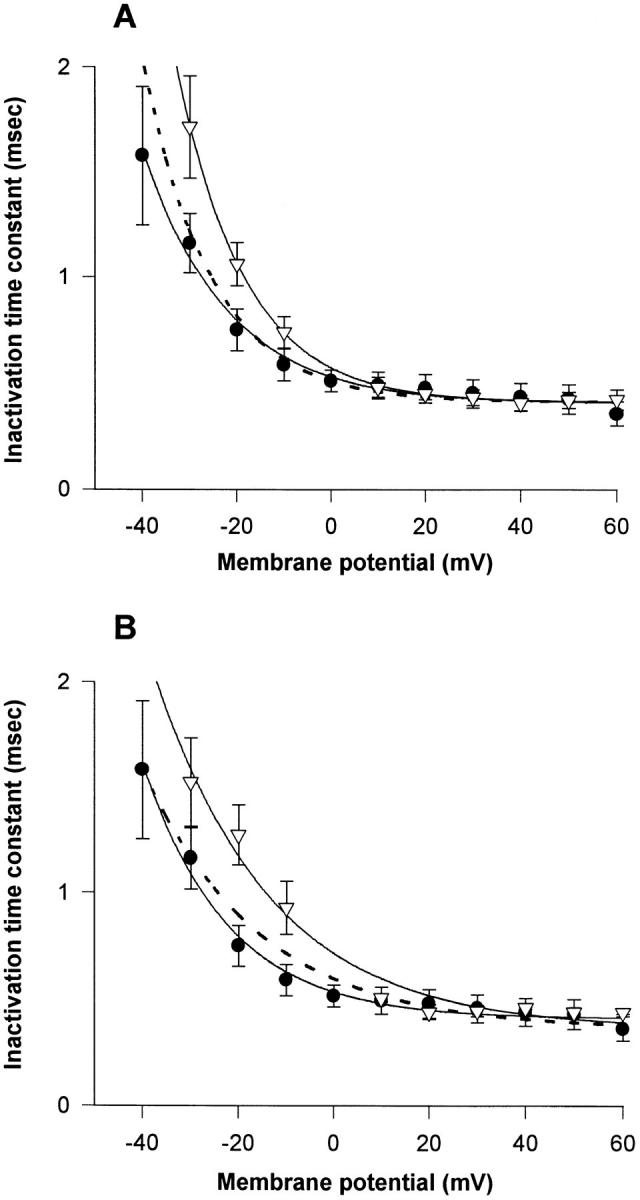
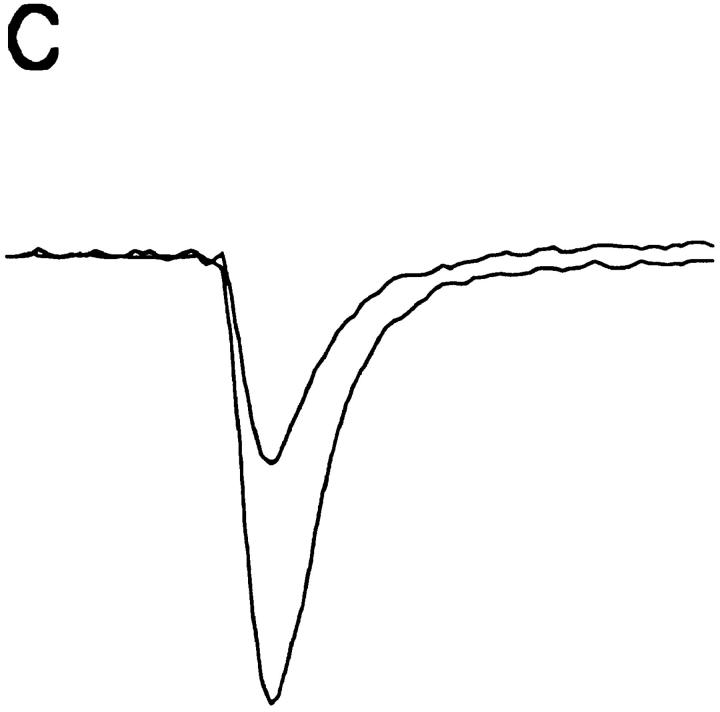
A potential role for sialic acid in the voltage-dependent gating of rat skeletal muscle sodium channels (rSkM1) was investigated using Chinese hamster ovary (CHO) cells stably transfected with rSkM1. Changes in the voltage dependence of channel gating were observed after enzymatic (neuraminidase) removal of sialic acid from cells expressing rSkM1 and through the expression of rSkM1 in a sialylation-deficient cell line (lec2). The steady-state half-activation voltages (Va) of channels under each condition of reduced sialylation were approximately 10 mV more depolarized than control channels. The voltage dependence of the time constants of channel activation and inactivation were also shifted in the same direction and by a similar magnitude. In addition, recombinant deletion of likely glycosylation sites from the rSkM1 sequence resulted in mutant channels that gated at voltages up to 10mV more positive than wild-type channels. Thus three independent means of reducing channel sialylation show very similar effects on the voltage dependence of channel gating. Finally, steady-state activation voltages for channels subjected to reduced sialylation conditions were much less sensitive to the effects of external calcium than those measured under control conditions, indicating that sialic acid directly contributes to the negative surface potential. These results are consistent with an electrostatic mechanism by which external, negatively charged sialic acid residues on rSkM1 alter the electric field sensed by channel gating elements.


Figures

Figure 10
Figure 10
The voltage-dependence of steady-state gating of rSkM1 deletion mutants Δ1-5 and Δ2-5 is altered similarly to rSkM1 expressed under conditions of reduced sialylation. Filled circles: CHOμ1 (n = 10). Open triangles: Δ1-5 (n = 10). Filled triangles: Δ2-5 (n = 9). Points are means ± SEM and curves are fits of the data to single Boltzmann distributions. (A) G-V relationship. Inset (left): Western blot of cell extracts of CHO-μ1, nontransfected CHO (NT), and CHO lines transfected with Δ1-5 and Δ2-5 rSkM1 deletion mutants. Inset (right): Densitometric scans of major band region (bracket on blot) of CHO-μ1 (solid trace) and Δ1-5–transfected cells (broken trace), scaled as in Fig. 4. Densitometric scan of Δ2-5 lane was nearly identical to scan of Δ1-5 (not shown). (B) Steady state inactivation.
Figure 4
Figure 4
Neuraminidase treatment affects steady-state gating of rSkM1 in CHOμ1 cells. Filled circles: control (untreated) currents; open triangles: currents following neuraminidase treatment. Points are means ± SEM. Curves are fits of the data to single Boltzmann distributions. Data were collected and analyzed as described in Fig. 2 and in materials and methods. (A) G-V relationship (n = 10 for both control and neuraminidase-treated groups). Inset (left): Western blot of cell homogenates from untreated control cells (C) and neuraminidase-treated cells (N). White marker lines show positions of peak density of major bands for comparison. Inset (right): Densitometric scans of major bands (bracket on blot) of untreated (solid trace) and neuraminidase-treated homogenates (broken trace). Data from both traces were scaled to allow better comparison of band mobilities. (B) Steady state inactivation (n = 10 for control, n = 8 for neuraminidase-treated groups).
Figure 2
Figure 2
rSkM1-transfected CHO cells express large sodium currents that differ from small endogenous currents. (A) Current trace from a cell transfected with rSkM1 (CHOμ1). Currents were elicited by a 9-ms depolarizing pulse to potentials ranging from −60 to +100 mV in 10-mV intervals from the −100 mV holding potential. (B) Whole-cell sodium current-voltage relationship for transfected and nontransfected CHO-K1 cells. Points represent the average current ± SEM at a test potential. Filled circles: transfected CHOμ1 cells (n = 10). Open triangles: nontransfected CHO-K1 (n = 12). Curves are nontheoretical, point to point lines. (C) Conductance-voltage relationship. Data are the average peak conductances ± SEM at a membrane potential. Curves are fits of the data to single Boltzmann distributions. Filled circles: transfected CHOμ1 cells (n = 10). Open triangles: nontransfected CHO-K1 cells (n = 12). (D) Steady-state inactivation. Data are the average normalized current ± SEM measured during a 35-ms pulse to −10 mV following a 500-ms prepulse to the potentials graphed. Curves are fits of the data to single Boltzmann distributions. Filled circles: transfected CHOμ1 cells (n = 8). Open triangles: nontransfected CHO-K1 cells (n = 8).
Figure 1
Figure 1
rSkM1 protein is expressed in stably transfected CHO cells. (A) Immunocytochemistry of sodium channels expressed in transfected and nontransfected cells. Main photo: transfected CHO-K1 (CHOμ1) cells; inset: nontransfected CHO-K1 cells. Fainter perinuclear stain of CHO-K1 cells is significant and probably reflects endogenous channels, as preincubation of AP2944 with EOIII reduced this pattern to a uniform dark background (data not shown). Scale bars = 50 μm. (B) Immunoblot of CHOμ1 homogenates. Lane 1: nontransfected CHO-K1 homogenate (10 μg protein). Lane 2: CHOμ1 homogenate (2.5 μg protein). Lane 3: rat skeletal muscle homogenate (7 μg protein). Bands smaller than 200 kD are thought to be channel breakdown products, as these disappeared with preincubation of primary antibody with EOIII antigen (data not shown).
Figure 1
Figure 1
rSkM1 protein is expressed in stably transfected CHO cells. (A) Immunocytochemistry of sodium channels expressed in transfected and nontransfected cells. Main photo: transfected CHO-K1 (CHOμ1) cells; inset: nontransfected CHO-K1 cells. Fainter perinuclear stain of CHO-K1 cells is significant and probably reflects endogenous channels, as preincubation of AP2944 with EOIII reduced this pattern to a uniform dark background (data not shown). Scale bars = 50 μm. (B) Immunoblot of CHOμ1 homogenates. Lane 1: nontransfected CHO-K1 homogenate (10 μg protein). Lane 2: CHOμ1 homogenate (2.5 μg protein). Lane 3: rat skeletal muscle homogenate (7 μg protein). Bands smaller than 200 kD are thought to be channel breakdown products, as these disappeared with preincubation of primary antibody with EOIII antigen (data not shown).
Figure 3
Figure 3
Sodium currents in rSkM1-transfected CHO cells are μ-conotoxin sensitive. (A) Effect of μ-conotoxin on sodium currents expressed in CHOμ1. Currents were elicited by a 9-ms pulse to −10 mV from the −100 mV holding potential. (B) Concentration dependence of μ-conotoxin inhibition of CHOμ1 sodium currents. Data are the average peak currents ± SEM elicited by a −10-mV test pulse, normalized to the current observed at zero toxin concentration (n = 4–5 at each concentration). Curve is a fit of the data to the equation:formula image where K d is the dissociation constant for μ-conotoxin, calculated to be 20.4 nM. The horizontal line is the average level of μ-conotoxin insensitive endogenous current (6% of the average peak current).
Figure 5
Figure 5
Kinetic gating behavior of rSkM1 is altered by treatment of CHOμ1 cells with neuraminidase. Filled circles: control (untreated) currents; open triangles: currents following neuraminidase treatment. Points are means ± SEM. Curves are fits of the data to single exponential functions. Time constants were measured as described in materials and methods. (A) Time constants of activation for rSkM1 expressed in CHOμ1 cells ± neuraminidase treatment. Broken line shows fit of activation time constants for neuraminidase-treated channels following a −7-mV shift along the voltage axis (n = 6 for both control and neuraminidase-treated groups). (B) Time constants of inactivation for rSkM1 expressed in CHOμ1 cells ± neuraminidase treatment. Broken line shows fit of inactivation time constants for neuraminidase-treated channels following a −7-mV shift along the voltage axis (n = 6 for both control and neuraminidase-treated groups).
Figure 6
Figure 6
Steady-state gating of rSkM1 is altered in the sialylation-deficient CHO lec2 cell line. Filled circles: parent (wild-type) pro5 rSkM1 currents; open triangles: lec2 rSkM1 currents. Points are means ± SEM. Data were obtained and analyzed as described in Fig. 2. (A) G-V relationship (n = 11 for pro5, n = 10 for lec2). (B) Steady-state inactivation (n = 9 for pro5, n = 12 for lec2).
Figure 7
Figure 7
The kinetics of rSkM1 gating are altered in lec2 cells. Filled circles: parent (wild-type) pro5 rSkM1 currents; open triangles: sialylation-deficient lec2 rSkM1 currents. Points are means ± SEM. Curves are fits of the data to single exponential functions. Time constants were measured as described in materials and methods. (A) Time constants of activation for rSkM1 expressed in pro5 and lec2 cells. Broken line shows fit of activation time constants for lec2 channels following a −7-mV shift along the voltage axis (n = 6 for pro5 and lec2 groups). (B) Time constants of inactivation for rSkM1 expressed in pro5 and lec2 cells. Broken line shows fit of inactivation time constants for lec2 channels following a −7-mV shift along the voltage axis (n = 6 for pro5 and lec2 groups).
Figure 8
Figure 8
The effect of external calcium on steady state activation of rSkM1 is diminished under conditions of reduced sialylation. G-V relationships for rSkM1 as expressed in four different cell lines under two different external calcium concentrations for each. Filled circles: 2 mM calcium; open circles: 0.2 mM calcium (A and B) or 0.5 mM calcium (C and D). Points are means of three experiments (two for pro5 data). Lines are fits of the data to single Boltzmann distributions. ΔV denotes the average difference in Va ± SEM between calcium concentrations. (A) Untreated CHOμ1 cells, ΔV = 9.2 ± 0.6 mV. (B) CHOμ1 cells treated with neuraminidase, ΔV = 3.5 ± 0.8 mV. (C) pro5 cells, ΔV = 7.7 ± 0.5 mV. (D) Sialylation- deficient lec2 cells, ΔV = 2.4 ± 0.7 mV.
Figure 9
Figure 9
Schematic of rSkM1 and mutant clones. (A) Schematic of predicted secondary structure of rSkM1. The semi-homologous domains are labeled I-IV. Putative transmembrane spanning regions are labeled S1-S6. The pore forming regions are labeled A1 and A2. Potential sites of N-glycosylation are demarcated with a dot. Some sites are shown arbitrarily to be unglycosylated, as it is currently uncertain whether all are indeed modified either in CHO cells or native tissue. (B) Schematic illustrating the deletion constructs made. The left side is an enlargement of Domain I from A. Some of the potential N-glycosylation sites within the mutated loop are numbered arbitrarily for identification. The right side of the panel shows which sites were removed. As numbered, sites 1–5 and 2–5 were deleted for Δ1-5 and Δ2-5, respectively, resulting in a 30 mer and 24 mer deletion in this loop.
Figure 11
Figure 11
Inactivation removal does not effect the relative shift in steady-state activation between wild-type and mutant rSkM1 channels. Steady-state activation of rSkM1 and Δ2-5 in the presence and absence of inactivation. Data are the mean ± SEM conductance at a membrane potential. Curves are fits of the data to single Boltzmann distributions. Open circles: rSkM1, inactivation present (n = 10). Open triangles: Δ2-5, inactivation present (n = 9). Filled circles: rSkM1, inactivation removed (n = 10). Filled triangles: Δ2-5, inactivation removed (n = 10).
Figure 12
Figure 12
Mutant channel activation gating kinetics are shifted in the same direction and with similar magnitude as steady-state gating parameters. Time constants of activation and deactivation as functions of membrane potential. Data are mean ± SEM time constants at a membrane potential. Circles represent time constants of channel activation. Squares represent time constants of channel deactivation. Lines are nontheoretical point-to-point. Broken lines represent the deletion mutant data shifted by the same magnitude observed for shifts in steady state activation for the same mutant (Table I). (A) Filled symbols: rSkM1 (n = 6). Open symbols: Δ1-5 (n = 8). Broken line represents mutant data shifted by 7 mV. (B) Filled symbols: rSkM1 (n = 6). Open symbols: Δ2-5 (n = 8). Broken line represents mutant data shifted by 10 mV.
Figure 13
Figure 13
Inactivation gating kinetics shift similarly to activation gating kinetics. Time constants of channel inactivation as functions of membrane potential. Data are mean ± SEM time constants at a membrane potential. Solid curves are fits of the data to single exponential functions. Broken lines are fits of the mutant data to single exponentials following a 7- or 10-mV shift as described in Fig. 12. (A) Filled circles: rSkM1 (n = 6). Open triangles: Δ1-5 (n = 8). Broken line represents fit of mutant data to single exponential following a 7-mV shift. (B) Filled circles: rSkM1 (n = 6). Open triangles: Δ2-5 (n = 8). Broken line represents fit of mutant data to single exponential following a 10-mV shift.
Figure 14
Figure 14
Mutant channel steady state activation is less affected by external calcium levels. Steady-state activation of rSkM1 and Δ2-5 at two different external calcium concentrations. Data are the mean conductance at a membrane potential. Filled circles: Conductance at 2.0 mM external calcium. Open circles: Conductance at 0.2 mM external calcium. (n = 3 for all data). Curves are fits of the data to single Boltzmann distributions. Average difference in Va between calcium concentrations was 9.2 ± 0.6 mV for rSkM1 (A) versus 5.2 ± 0.7 mV for Δ2-5 (B).
Figure 15
Figure 15
rSkM1 and the two mutant channels are similarly sensitive to μ-conotoxin. Traces are whole cell currents measured during a 9-ms pulse to −10 mV before and after the administration of 50 nM μ-conotoxin. Percentage inhibition ranged from 53 to 60%. (A) rSkM1; (B) Δ1-5; (C) Δ2-5.
Figure 15
Figure 15
rSkM1 and the two mutant channels are similarly sensitive to μ-conotoxin. Traces are whole cell currents measured during a 9-ms pulse to −10 mV before and after the administration of 50 nM μ-conotoxin. Percentage inhibition ranged from 53 to 60%. (A) rSkM1; (B) Δ1-5; (C) Δ2-5.
Figure 15
Figure 15
rSkM1 and the two mutant channels are similarly sensitive to μ-conotoxin. Traces are whole cell currents measured during a 9-ms pulse to −10 mV before and after the administration of 50 nM μ-conotoxin. Percentage inhibition ranged from 53 to 60%. (A) rSkM1; (B) Δ1-5; (C) Δ2-5.

References

    1. Armstrong CM, Cota G. Calcium ion as a cofactor in Na channel gating. Proc Natl Acad Sci USA. 1991;88:6528–6531. - PMC - PubMed
    1. Auld VJ, Goldin AL, Krafte DS, Catterall WA, Lester HA, Davidson N, Dunn RJ. A neutral amino acid change in segment IIS4 dramatically alters the gating properties of the voltage-dependent sodium channel. Proc Natl Acad Sci USA. 1990;87:323–327. - PMC - PubMed
    1. Campbell DT, Hille B. Kinetic and pharmacological properties of the sodium channel of frog skeletal muscle. J Gen Physiol. 1976;67:309–323. - PMC - PubMed
    1. Chen CA, Okayama H. Calcium-phosphate-mediated gene transfer: A highly efficient transfection system for stably transforming cells with plasmid DNA. Biotechniques. 1988;6:632–638. - PubMed
    1. Cota G, Armstrong CM. Sodium channel gating in clonal pituitary cells. The inactivation step is not voltage dependent. J Gen Physiol. 1989;94:213–232. - PMC - PubMed

Publication types

MeSH terms