. 1997 Mar;109(3):371-84.
doi: 10.1085/jgp.109.3.371.

Light adaptation in Pecten hyperpolarizing photoreceptors. Insensitivity to calcium manipulations

Affiliations

Light adaptation in Pecten hyperpolarizing photoreceptors. Insensitivity to calcium manipulations

M P Gomez et al. J Gen Physiol. 1997 Mar.

Abstract

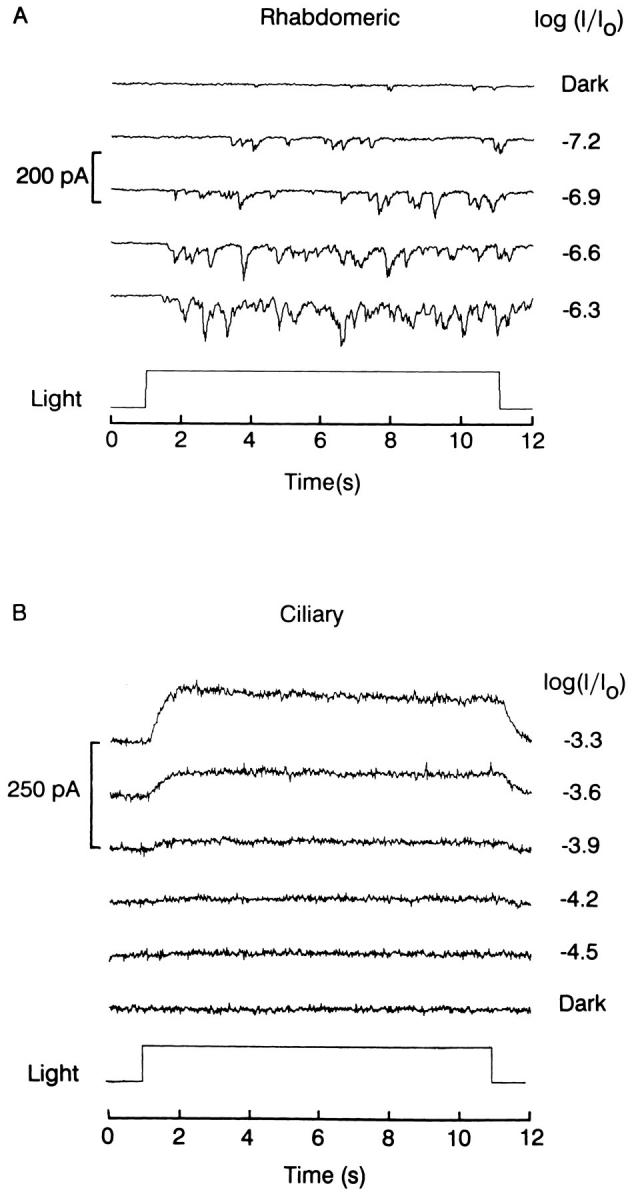
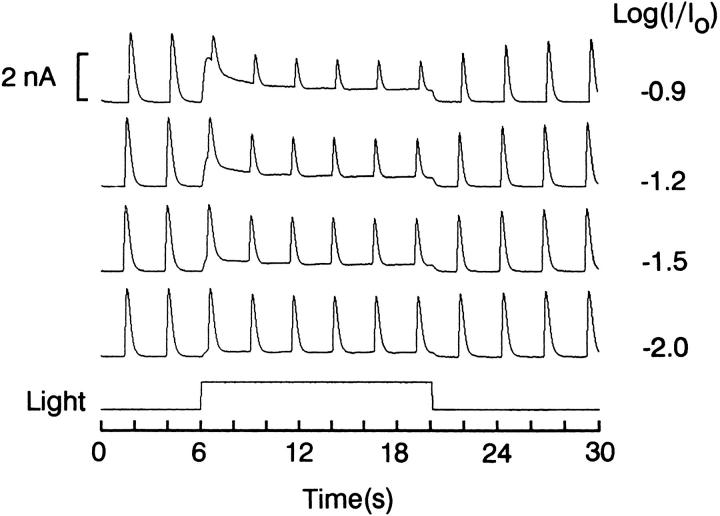
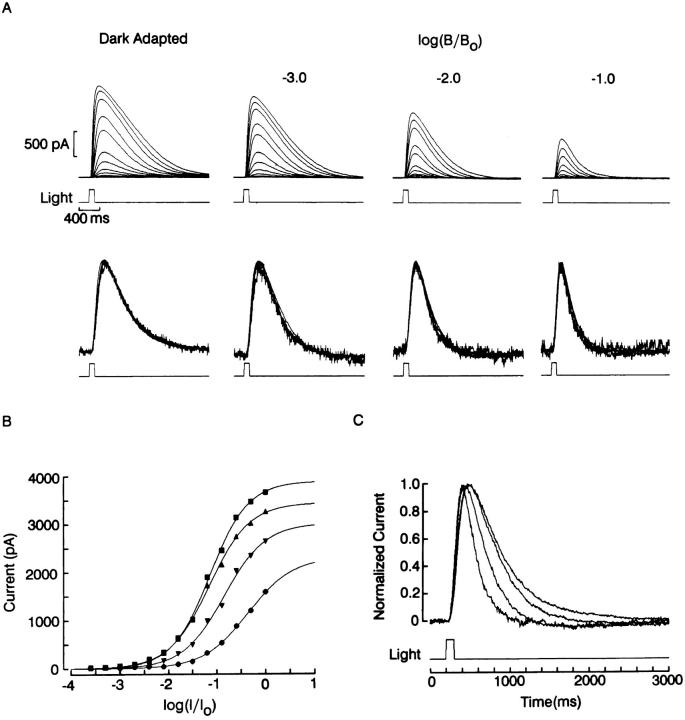
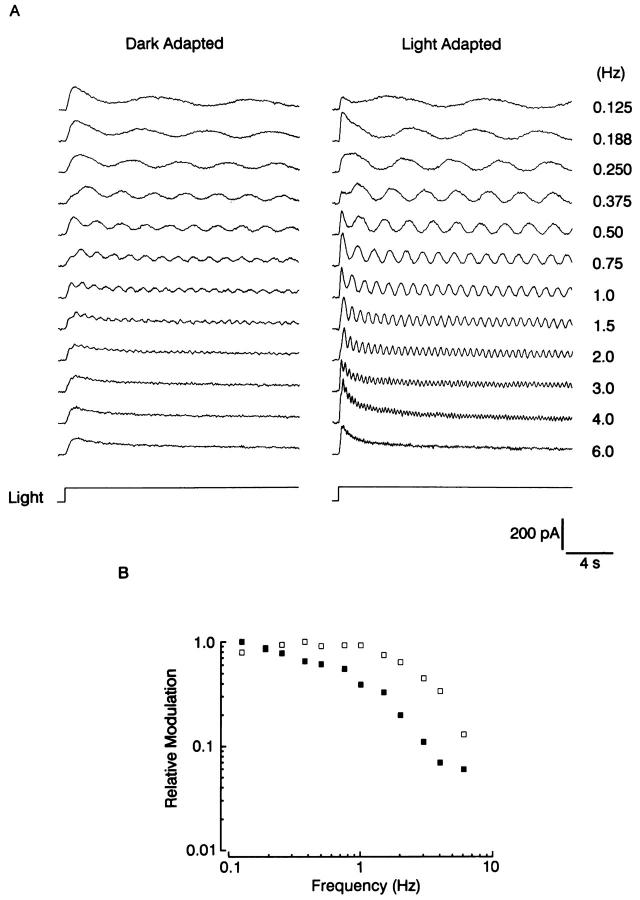
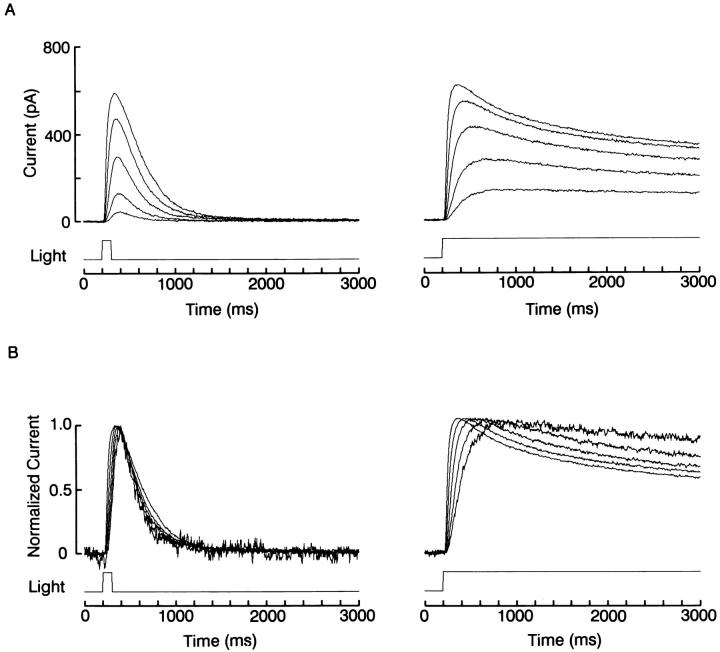
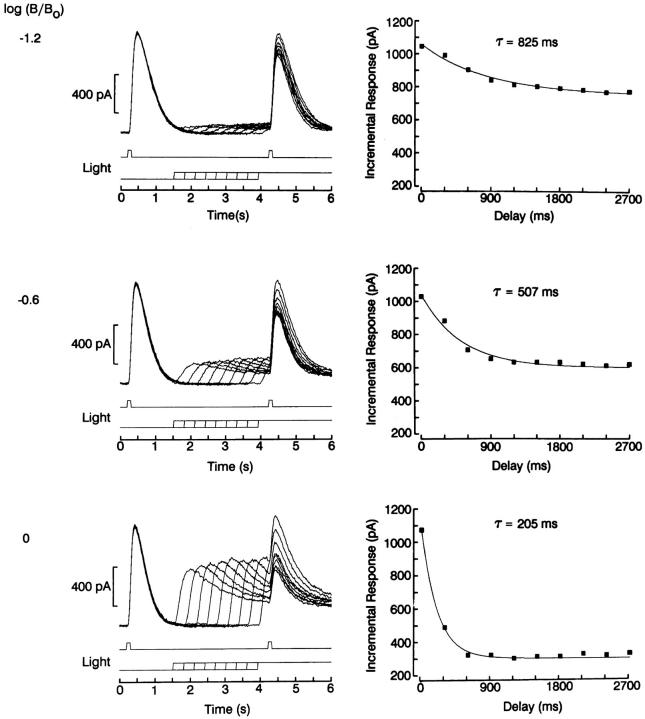
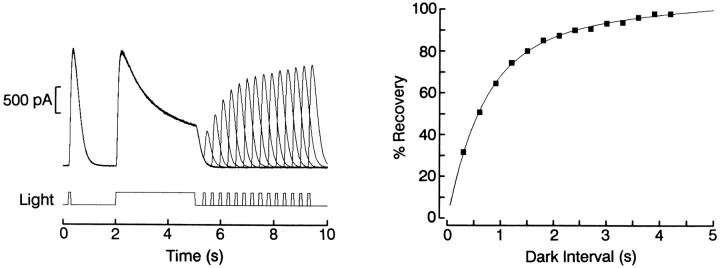
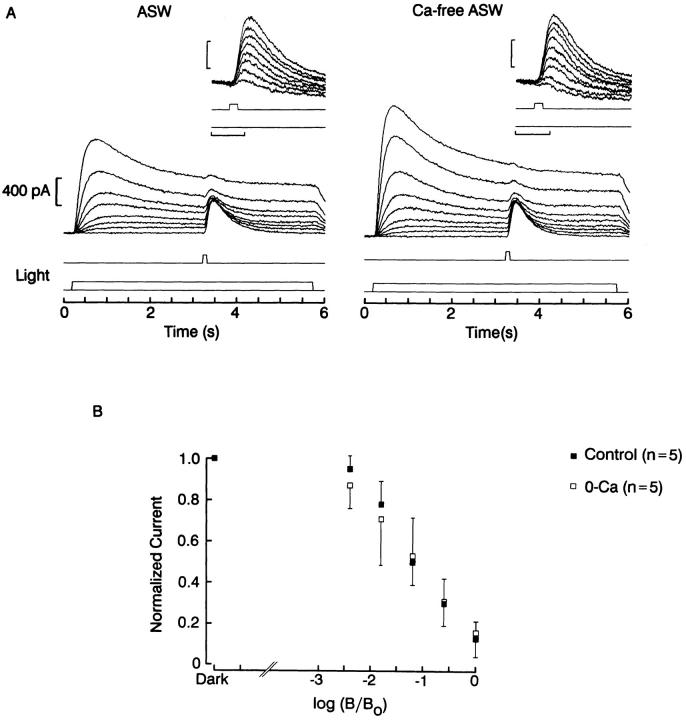
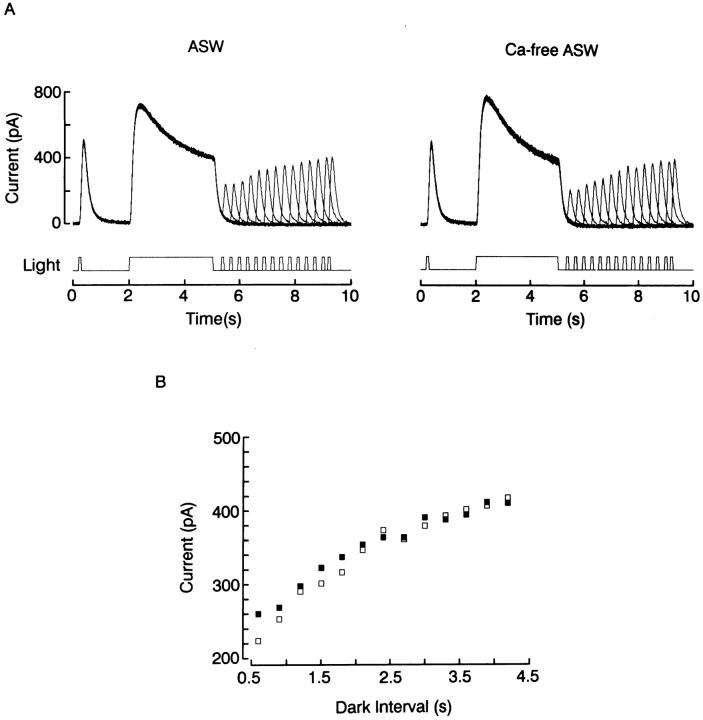
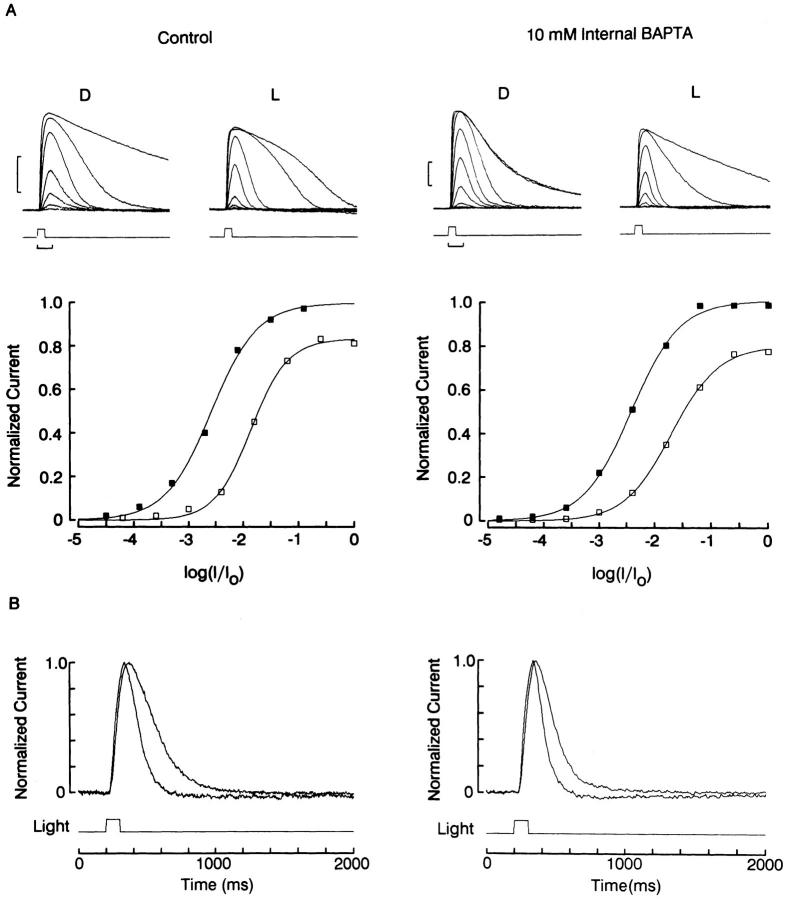
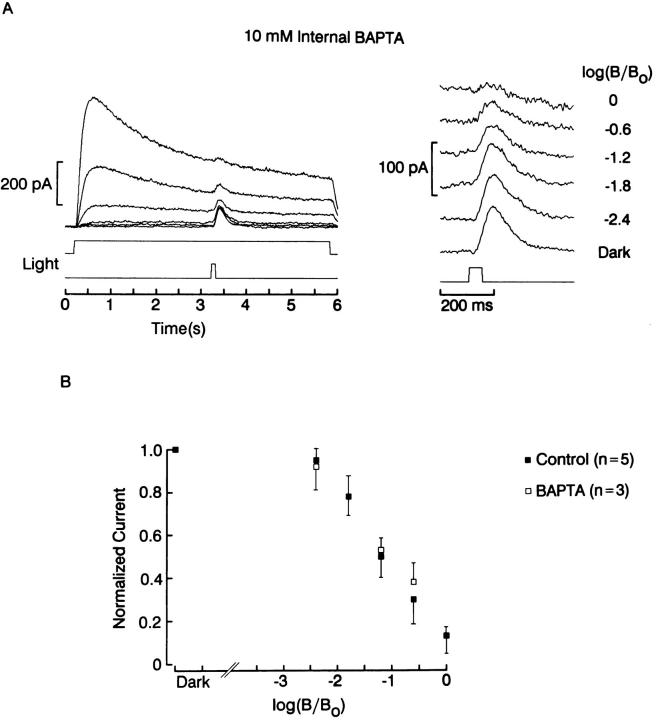
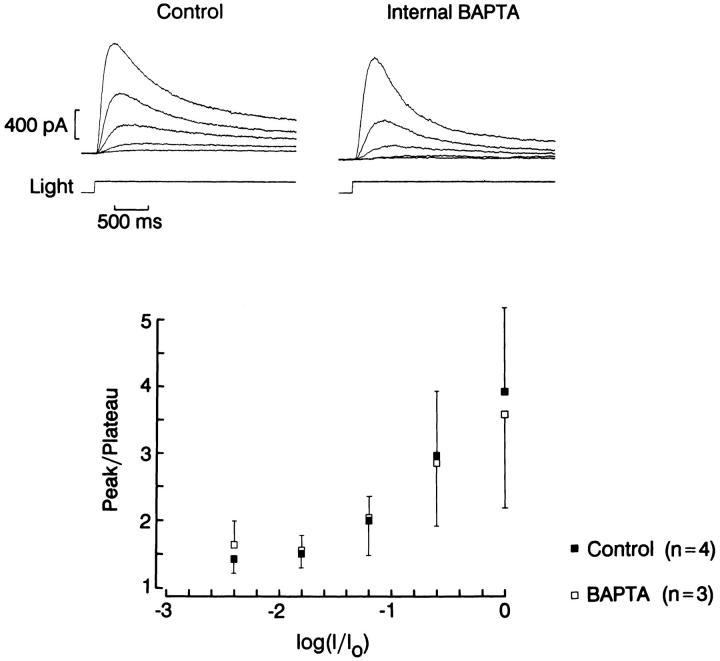
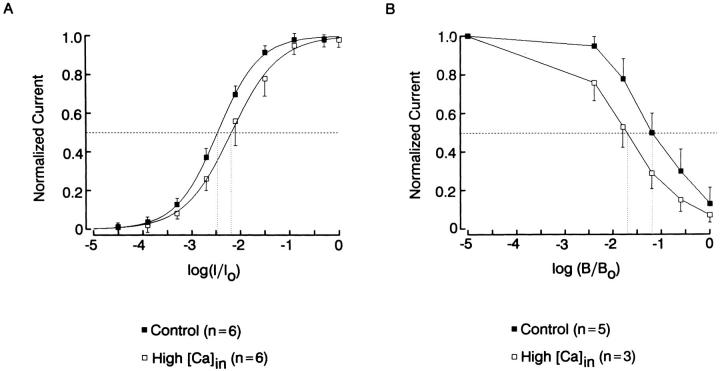
The ability of scallop hyperpolarizing photoreceptors to respond without attenuation to repetitive flashes, together with their low light sensitivity, lack of resolvable quantum bumps and fast photoresponse kinetics, had prompted the suggestion that these cells may be constitutively in a state akin to light adaptation. We here demonstrate that their photocurrent displays all manifestations of sensory adaptation: (a) The response amplitude to a test flash is decreased in a graded way by background or conditioning lights. This attenuation of the response develops with a time constant of 200-800 ms, inversely related to background intensity. (b) Adapting stimuli shift the stimulus-response curve and reduce the size of the saturating photocurrent. (c) The fall kinetics of the photoresponse are accelerated by light adaptation, and the roll-of of the modulation transfer function is displaced to higher frequencies. This light-induced desensitization exhibits a rapid recovery, on the order of a few seconds. Based on the notion that Ca mediates light adaptation in other cells, we examined the consequences of manipulating this ion. Removal of external Ca reversibly increased the photocurrent amplitude, without affecting light sensitivity, photoresponse kinetics, or susceptibility to background adaptation; the effect, therefore, concerns ion permeation, rather than the regulation of the visual response. Intracellular dialysis with 10 mM BAPTA did not reduce the peak-to-plateau decay of the photocurrent elicited by prolonged light steps, not the background-induced compression of the response amplitude range and the acceleration of its kinetics. Conversely, high levels of buffered free [Ca]i (10 microM) only marginally shifted the sensitivity curve (delta sigma = 0.3 log) and spared all manifestations of light adaptation. These results indicate that hyperpolarizing invertebrate photoreceptors adapt to light, but the underlying mechanisms must utilize pathways that are largely independent of changes in cytosolic Ca. The results are discussed in terms of aspects of commonalty to other ciliary sensory receptor cells.


Figures

Figure 1
Figure 1
Lack of resolvable quantum bumps in ciliary cells. (A) Example of single-photon responses in a rhabdomeric photoreceptor voltage clamped at −50 mV. Light steps of the indicated relative intensities were presented for 10 s. (B) Smooth photocurrent evoked by threshold stimulation in a ciliary photoreceptor. Similar protocol as in A, except that the holding potential was −30 mV. Unattenuated light intensity: 3.8 × 10¹⁵ photons · cm−2 · s−1 (A), and 4.2 × 10¹⁵ photons · cm−2 · s−1 (B).
Figure 2
Figure 2
Comparison of photocurrent sensitivity and kinetics in rhabdomeric and ciliary photoreceptors. (A) Left: Light-evoked inward currents elicited by flashes of increasing intensity in a rhabdomeric photoreceptor voltage clamped at −50 mV. Right: Outward photocurrents in a ciliary photoreceptor; holding potential −30 mV. (B) Normalized peak amplitude of the photocurrent for the two families of recordings shown in A; sigmoidal functions of the form y(x) = S/{1 + exp[α(σ − x)]}, where S, α, σ > 0, were fitted to the two sets of data points by the method of least squares. The difference in half-saturating light for the two cells was 2.5 log. Unattenuated light intensity: 10.8 × 10¹⁵ photons · cm−2 · s−1, flash duration 100 ms.
Figure 3
Figure 3
Effect of background light on the response to brief test flashes. A ciliary photoreceptor was voltage clamped at −20 mV and stimulated by 20-ms flashes every 2.5 s (8.1 × 10¹⁵ equivalent photons · cm−2 · s−1). After 6 s of this regime, a steady light was turned on for 14 s; four different background intensities were examined (from 4.2 to 52 × 1013 photons · cm−2 · s−1). The sustained light caused a graded, reversible reduction in the amplitude of the responses to the test flashes. During the background light, the total membrane current at the peak of the responses to the test flashes was lower than the value attained in the absence of the adapting background.
Figure 4
Figure 4
Photoresponse sensitivity and kinetics changes induced by background illumination. (A) Intensity series with brief flashes (100 ms) measured in the dark adapted state (left) and in the presence of a progressively more intense background light. Holding potential was −20 mV; test flash intensity stepped at 0.3 log increments (unattenuated test light intensity 8.1 × 10¹⁵ photons · cm−2 · s−1; unattenuated background intensity 4.2 × 10¹⁵ photons · cm−2 · s−1). Flashes were spaced 1 min apart and were followed by a 3-s red light (λ > 630 nm, 14.8 mW · cm−2) to ensure constancy of chromatic adaptation throughout the procedure. Second row : normalized superimposed responses to flashes varying over 1.5 log units, for each of the background conditions. In each set of recordings the photocurrent follows a similar time course, irrespective of flash intensity. (B) Peak amplitude of the photocurrent plotted as a function log attenuation of the test light, for each of the four background conditions. Sigmoidal functions were least-squares fitted to the data points via a Simplex minimization algorithm. Increasing background illumination induced a reduction of the asymptotic response amplitude and a shift of the stimulus- response curves along the abscissa. (C) Superimposed, normalized photocurrents from each group in response to a half-saturating light. Adaptation induced an acceleration of the response kinetics, graded with the intensity of the background light.
Figure 5
Figure 5
Changes in the temporal modulation transfer function induced by light adaptation. (A) The test light, λ = 580 nm, was presented for 20 s, and its intensity was sinusoidally modulated with a 15% depth, at the frequencies indicated in the right column. The recordings on the left were obtained with a dim light (average intensity 16.5 × 10¹² photons · cm−2 · s−1), whereas on the right the cell was exposed to a steady adapting background (3.8 × 10¹³ photons · cm−2 · s−1), and the superimposed modulated light step intensity was increased by 1.2 log, to produce an incremental response of amplitude comparable to the control response. Light adaptation substantially increased the ability of the photocurrent to follow higher frequencies. (B) Plot of the modulation transfer function for the two conditions. In the dark-adapted state (filled squares) the response modulation dropped to 50% of the low-frequency asymptote around 0.75 Hz. With light adaptation, the roll-off was shifted to ≈2.5 Hz.
Figure 6
Figure 6
Comparison of flash vs. step response kinetics. (A) Effects of increasing light intensity over a range spanning 2.4 log (from 8.3 × 10¹² to 2.1 × 10¹⁵ photons · cm−2 · s−1) in a cell stimulated with 100-ms flashes (left) or with sustained light steps (right). (B) Superimposed, normalized traces from the two families of recordings, showing that with brief stimuli the time course of the responses changed little, whereas with prolonged illumination the photocurrent developed a distinct decay phase as the intensity of the stimulus was increased. Holding potential was −20 mV.
Figure 7
Figure 7
Time course of the onset of light adaptation. Left: Two identical test flashes, 100 ms in duration were delivered 4 s apart. In the time between the two stimuli, a steady background light was turned on, preceding the second test flash by an interval that varied, on successive trials, between 300 and 2,700 ms. As this interval was made longer, the amplitude of the incremental response to the second test flash decreased progressively. The sequence was repeated three times in the same cell, reducing the attenuation of the background light at 0.6 log increments, as indicated on the left of each panel. Right: Peak amplitude of the incremental response plotted as a function of temporal lag between onset of the adapting background and delivery of the second test flash. Data points were least-squares fitted by a single exponential function by means of a Simplex algorithm. The time constant of the desensitization process and the asymptotic amplitude of the response decreased as the intensity of the background increased. Holding potential: −40 mV; test flash intensity: 16.4 × 10¹⁴ photons · cm−2 · s−1; unattenuated background intensity: 7.3 × 10¹⁴ photons · cm−2 · s−1.
Figure 8
Figure 8
Time course of the recovery from light adaptation. Left: A photoreceptor was stimulated with a triple-stimulus protocol, consisting of a 100-ms test flash which served as a reference, a 3-s adapting light, and a second test flash. The interval between the termination of the adapting light and the second test flash was varied between 300 and 4,200 ms, at 200-ms increments. A 1-min period of dark adaptation was interposed between trials. The responses to both the pre-test flash and the adapting light are superimposable, indicating that no response rundown occurred. Right: Peak amplitude of the test response plotted as a function of time elapsed since termination of the adapting light. The data points were fitted by a two-time constant exponential (τ1 = 590 ms; τ2 = 4 s). Light intensity 2.1 × 10¹⁵ photons · cm−2 · s−1 for all stimuli. Holding potential was −40 mV.
Figure 9
Figure 9
Effects of removal of extracellular Ca on adaptation. (A) The response to 100-ms test flashes delivered in the dark or superimposed upon a 5-s background light was examined in standard ASW (left) and after superfusing the cell with Ca-free solution (right). The amplitude of the photocurrents increased in 0-Ca, but in both conditions the incremental flash response decreased as the background light intensity increased (insets). (B) Peak amplitude of the incremental responses normalized with respect to the dark-adapted value, plotted as a function of the attenuation of the background light. The relative reduction of sensitivity induced by the adapting light did not differ significantly in the two conditions. Test flash intensity: 16 × 1015 photons · cm−2 · s−1; unattenuated background intensity: 4.2 × 10¹⁵ photons · cm−2 · s−1.
Figure 10
Figure 10
Effects of removal of extracellular Ca on recovery from adaptation. (A) A photoreceptor was tested with a triple-stimulus protocol, in which the delay between the termination of an adapting light presented for 3 s and a 100-ms test flash was varied systematically. Superfusion with 0-Ca did not alter the time course of the recovery from adaptation, as shown in part (B), in which the peak amplitude of the test response is plotted as a function of the time between adapting and test lights in ASW (filled squares) and in 0-Ca ASW (empty squares). Light intensity: 4.7 × 10¹⁴ photons · cm−2 · s−1; holding potential: −20 mV.
Figure 11
Figure 11
Effect of intracellular dialysis with BAPTA. (A) Photoreceptor cells were stimulated with flashes of increasing intensity in the dark-adapted state (D) or in the presence of a steady background illumination (L). The two families of recordings on the left were obtained with the standard internal solution containing 1 mM EGTA; the ones on the right were obtained with 10 mM BAPTA in the patch pipette. In both conditions the background light compressed the amplitude range of the response (calibration bars: left, 200 ms/200 pA; right, 200 ms/100 pA). The corresponding plots of the peak response amplitude as a function of the log of test light attenuation show that in both conditions the background light caused a similar reduction of the saturating flash response (80–85%), and a nearly identical shift of the light intensity eliciting a half-maximal photocurrent (Δσ = 0.73 log). (B) Normalized half saturating responses measured in the dark-adapted and the light-adapted state. Both the control and the BAPTA-treated photoreceptor exhibit a pronounced acceleration of the photoresponse kinetics in the presence of the background light. Test flashes were 100 ms in duration; unattenuated intensity: 11 × 1016 photons · cm−2 · s−1. Background light intensity: 5.3 × 10¹⁴ photons · cm−2 · s−1. Holding potential: −20 mV; cells superfused with standard ASW.
Figure 12
Figure 12
Susceptibility to adaptation by background light, in the presence or absence of intracellular BAPTA. (A) A photoreceptor voltage-clamped at −30 mV with a patch pipette containing 10 mM BAPTA was exposed to a 5-s light at 0.6 log increments of intensity, with a superimposed test flash 100 ms in duration (16.4 × 1013 photons · cm−2 · s−1). The incremental response (right) decreased in amplitude as the background was made brighter. (B) Normalized photocurrent, averaged for three cells treated with BAPTA and five control cells, plotted as a function of the intensity of the adapting light. There were no significant differences in susceptibility to adaptation in the presence of BAPTA. Unattenuated background intensity: 7.3 × 10¹⁴ photons · cm−2 · s−1.
Figure 13
Figure 13
Effect of intracellular BAPTA on the peak-to-plateau decay of the photocurrent. A sustained light was used to stimulate photoreceptors dialyzed with the control (left) or the BAPTA-containing intracellular solution (right). BAPTA did not attenuate the relaxation of the photocurrent as the light intensity increased. The ratio peak/plateau photocurrent amplitude at each light intensity is plotted on the bottom. No statistically significant differences were detected. Unattenuated light intensity: 7.3 × 10¹⁴ photons · cm−2 · s−1; holding potential: −30 mV.
Figure 14
Figure 14
(A) Intensity-response function averaged for six control cells (1 mM EGTA in the intracellular solution, no added Ca), and six cells internally perfused with 10 μM free Ca. In the high-Ca condition the curve shifted marginally to the right (Δσ = 0.3 log). (B) Reduction in the amplitude of the incremental response to a fixed test flash (100 ms, 16.4 × 10¹³ photons · cm−2 · s−1) as a function of the intensity of background illumination. In the presence of elevated internal Ca the background intensity causing a 50% reduction in the test response was shifted to the left by 0.49 log. Unattenuated intensity of the background light 7.3 × 10¹⁴ photons · cm−2 · s−1.

Similar articles

Cited by

References

    1. Bader CR, Baumann F, Bertrand D. Role of intracellular calcium and sodium in light adaptation on the retina of the honey bee drone (Apis mellifera, L.) . J Gen Physiol. 1976;67:475–491. - PMC - PubMed
    1. Boekhoff I, Breer H. Termination of second messenger signaling in olfaction. Proc Natl Acad Sci USA. 1992;89:471–474. - PMC - PubMed
    1. Bolsover SR, Brown JE. Calcium ion, an intracellular messenger of light adaptation, also participates in excitation of Limulusphotoreceptors. J Physiol (Camb) 1985;364:381–393. - PMC - PubMed
    1. Brown JE, Blinks JR. Changes in intracellular free calcium concentration during illumination of invertebrate photoreceptors. J Gen Physiol. 1974;64:643–665. - PMC - PubMed
    1. Brown HM, Hagiwara S, Koike H, Meech RM. Membrane properties of a barnacle photoreceptor examined by the voltage clamp technique. J Physiol (Camb) 1970;208:385–413. - PMC - PubMed

Publication types