Comparative Study
. 1997 Apr 15;17(8):2859-68.
doi: 10.1523/JNEUROSCI.17-08-02859.1997.

Correlated size variations in human visual cortex, lateral geniculate nucleus, and optic tract

Affiliations
Comparative Study

Correlated size variations in human visual cortex, lateral geniculate nucleus, and optic tract

T J Andrews et al. J Neurosci. .

Abstract

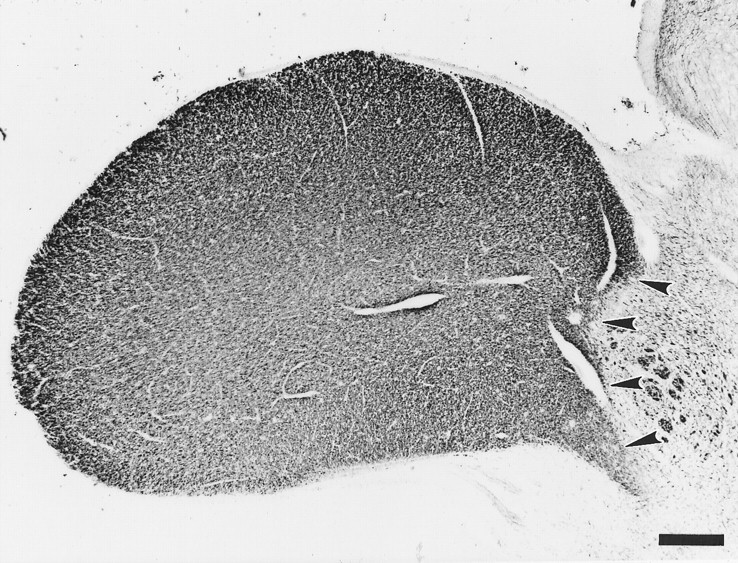
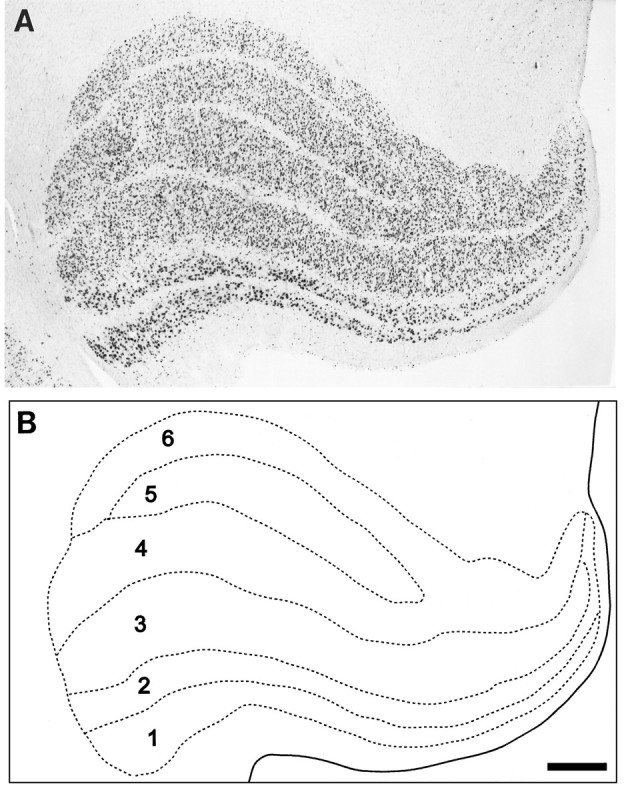
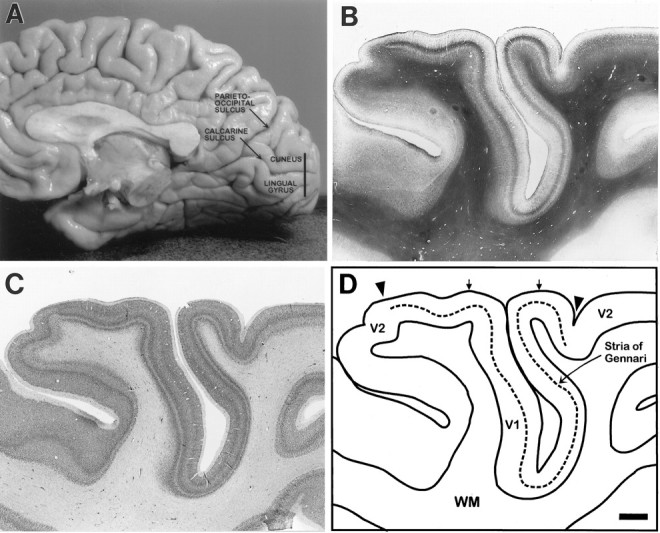
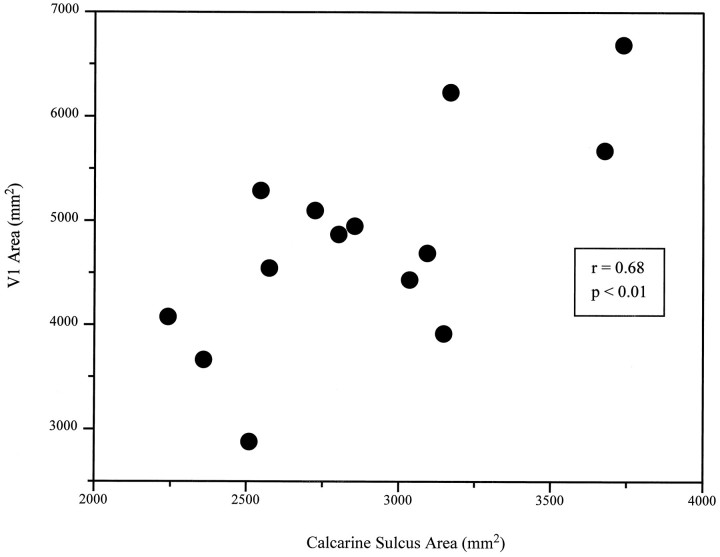
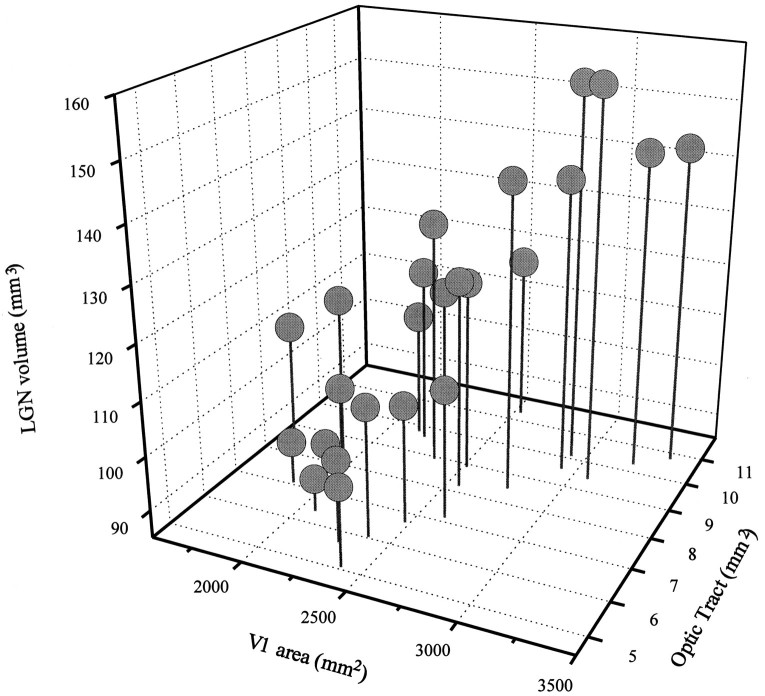
We have examined several components of the human visual system to determine how the dimensions of the optic tract, lateral geniculate nucleus (LGN), and primary visual cortex (V1) vary within the same brain. Measurements were made of the cross-sectional area of the optic tract, the volumes of the magnocellular and parvocellular layers of the LGN, and the surface area and volume of V1 in one or both cerebral hemispheres of 15 neurologically normal human brains obtained at autopsy. Consistent with previous observations, there was a two- to threefold variation in the size of each of these visual components among the individuals studied. Importantly, this variation was coordinated within the visual system of any one individual. That is, a relatively large V1 was associated with a commensurately large LGN and optic tract, whereas a relatively small V1 was associated with a commensurately smaller LGN and optic tract. This relationship among the components of the human visual system indicates that the development of its different parts is interdependent. Such coordinated variation should generate substantial differences in visual ability among humans.


Figures

Fig. 1.
Fig. 1.
Photomicrograph of a cross-section through the right optic tract stained for myelin. The border between the optic tract and the surrounding tissue (arrowheads) is defined by a sharp change in the density of myelin staining, allowing precise delineation of the tract. Scale bar, 500 μm.
Fig. 2.
Fig. 2.
The human LGN and methods used to measure it. A, Photomicrograph of a coronal section of the left LGN stained for Nissl substance. B, Tracing of the section shown in A demonstrating the distinctive laminar structure of the LGN. The magnocellular layers (1 and2) are discriminated from the parvocellular layers (3–6) by the much larger size of the constituent neurons and a diminished cell density. The areas (including the interlaminar space) encompassed by the two ventral magnocellular layers and the four dorsal parvocellular layers were measured by tracing along the borders of these regions. The interlaminar space between layers2 and 3 was used to bisect the magnocellular and parvocellular regions. Scale bar, 1 mm.
Fig. 3.
Fig. 3.
V1 and methods used to measure it.A, Photograph of the medial surface of the human occipital lobe showing the calcarine sulcus, the cuneus, and the lingual gyrus. The vertical line corresponds to the plane of section in B and C.B, Photomicrograph of a coronal section through the cuneus and lingual gyrus, stained for myelin. The medial surface of the hemisphere is represented by the upper border of the section. V1 is defined by a densely stained band of myelin in layer IVb (the stria of Gennari). C, Adjacent Nissl-stained section shows prominent cell-dense layer IVc and cell-sparse layers IVb and V that distinguish V1. D, Tracing of the sections inB and C to identify the cortical parameters measured. The extent of V1 (arrowheads) was determined by tracing the stria (dashed line) in the myelin-stained section and confirmed by the cytoarchitecture of the Nissl-stained section. Volume measurements were made by tracing the boundaries of V1 from the pial surface to the gray matter/white matter (WM) border. The arrows indicate the tangent points of the lingual gyrus (left) and cuneus (right) from which the extent of the calcarine sulcus was measured. Scale bar, 2 mm.
Fig. 4.
Fig. 4.
A scatter plot showing the correlation between the surface area of V1 and the surface area of the calcarine sulcus from both hemispheres in 14 brains. The strength of this correlation raises the possibility of being able to make a simple structural measurement using magnetic resonance imaging to assess the extent of V1 in vivo, which could then be compared with differences in visual ability.
Fig. 5.
Fig. 5.
Three-dimensional graph showing the relationship between the sizes of V1, LGN, and optic tract in 24 cerebral hemispheres. A strong correlation is apparent among these several components of the primary visual system. Thus, a small V1 tends to be associated with a relatively small LGN and optic tract, whereas a large V1 is associated with a commensurately large LGN and optic tract.

References

    1. Balazsi AG, Rootman J, Drance SM, Schulzer M, Douglas GR. The effect of age on the nerve fiber population of the human optic nerve. Am J Ophthalmol. 1984;97:760–766. - PubMed
    1. Barasa A. Forma, grandezza e densita dei neuroni della corteccia cerebrale in mammiferi di grandezz corporea differente. A Aellforschung. 1960;53:69–89.
    1. Benton AL, Varney NR, Hamsher KS. Visuospatial judgment: a clinical test. Archiv Neurol. 1978;35:364–367. - PubMed
    1. Boyd R. Tables of the weights of the human body and internal organs in the sane and insane of both sexes at various ages arranged from 2614 post-mortem examinations. Philos Trans. 1861;1:249–253.
    1. Brodmann K (1909) Vergleichende Lokalisationslehre der Grosshirnrinde in ihre Prinzipien dargestellt auf Grund des Zellenbaues. Barth, Leipzig.

Publication types

LinkOut - more resources