

doi: 10.1073/pnas.94.7.2787.
Imaging the living human brain: magnetic resonance imaging and positron emission tomography
Affiliations
- PMID: 9096295
- PMCID: PMC34149
- DOI: 10.1073/pnas.94.7.2787
Item in Clipboard
Imaging the living human brain: magnetic resonance imaging and positron emission tomography
Proc Natl Acad Sci U S A.
.
No abstract available
Figures
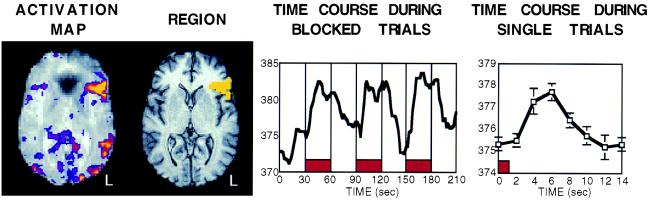
fMRI activation images obtained with a visually
guided generation task. The leftmost figure shows a horizontal section
of an activation map. Areas of increased activation (BOLD contrast) are
shown in brighter colors overlaid on top of a T2*
weighted image. Robust activations are seen in visual cortex and in
left prefrontal cortex. The image second to the left shows a region (in
yellow) that was defined around significantly activated voxels in left
prefrontal cortex. The next image shows the time course of this
region’s activity during periods where multiple trials of the
word-generation task were performed during 30-sec blocks (placement of
blocks shown in red). Note the consistent and sustained signal increase
that occurs shortly after the onset of the word-generation task. The
rightmost image shows what happens in the same left prefrontal region
when the time course is examined during a different paradigm involving
separated individual trials of the task. Within such a paradigm, a
small but reliable signal increase was observed in relation to the
onset of individual trials of the task (placement of the averaged
1.5-sec trial shown in red). Courtesy of Massachusetts General
Hospital.
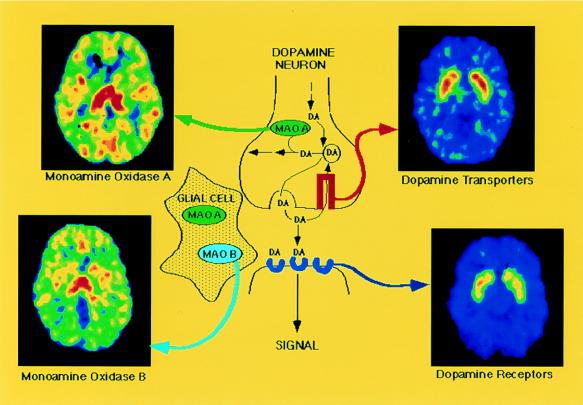
Diagram of the dopamine (DA) synapse along with
the PET images for different molecular targets: DA D2 receptors are
imaged with [11C]raclopride, DA transporters are imaged
with d-threo-[11C]methylphenidate,
monoamine oxidase A is imaged with [11C]clorgyline, and
monoamine oxidase B (located in glial cells) is imaged with
deuterium-substituted [11C]deprenyl. Courtesy of
Brookhaven National Laboratory.
References
-
- Bandettini P A, Wong E C, Hinks R S, Tikofsky R S, Hyde J S. Magn Reson Med. 1992;25:390–397. - PubMed
-
- Phelps M E, Mazziotta J C, Schelbert H. Positron Emission Tomography and Autoradiography: Principles and Applications for the Brain and Heart. New York: Raven; 1986.
Publication types
MeSH terms
LinkOut - more resources
Full Text Sources
Other Literature Sources
