

Microsatellite diversity and the demographic history of modern humans
- PMID: 9096352
- PMCID: PMC20328
- DOI: 10.1073/pnas.94.7.3100
Microsatellite diversity and the demographic history of modern humans
Abstract
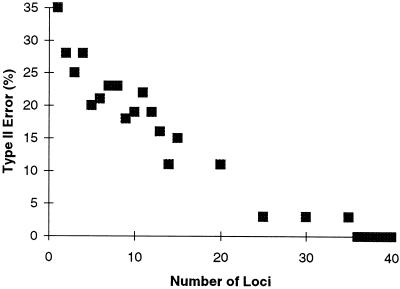
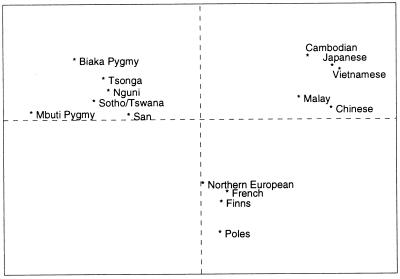
We have examined differences in diversity at 60 microsatellite loci among human population samples from three major continental groups to evaluate the hypothesis of greater African diversity in this rapidly evolving class of loci. Application of a statistical test that assumes equal mutation rates at all loci fails to demonstrate differences in microsatellite diversity, while a randomization test that does not make this assumption finds that Africans have significantly greater microsatellite diversity (P < 10(-8)) than do Asians and Europeans. Greater African diversity is most apparent at loci with smaller overall variance in allele size, suggesting that the record of population history has been erased at repeat loci with higher mutation rates. A power analysis shows that only 35-40 microsatellites are needed to establish this difference statistically, demonstrating the considerable evolutionary information contained in these systems. On average, African populations have approximately 20% greater microsatellite diversity than do Asian and European populations. A comparison of continental diversity differences in microsatellites and mtDNA sequences suggests earlier demographic expansion of the ancestors of Africans.
Figures
References
-
- Tishkoff S A, Dietzsch E, Speed W, Pakstis A J, Kidd J R, Cheung K, Bonné-Tamir B, Santachiara-Benerecetti A S, Moral P, Krings M, Pääbo S, Watson E, Risch N, Jenkins T, Kidd K K. Science. 1996;271:1380–1387. - PubMed
-
- Harpending H C, Sherry S T, Rogers A R, Stoneking M. Curr Anthropol. 1993;34:483–496.
-
- Lahr M M, Foley R. Evol Anthropol. 1994;3:48–60. - PubMed
-
- Vigilant L, Stoneking M, Harpending H, Hawkes K, Wilson A C. Science. 1991;253:1503–1507. - PubMed
-
- Armour J A L, Anttinen T, May C A, Vega E E, Sajantila A, Kidd J R, Kidd K K, Bertranpetit J, Pääbo S, Jeffreys A J. Nat Genet. 1996;13:154–160. - PubMed
Publication types
MeSH terms
Substances
Grants and funding
LinkOut - more resources
Full Text Sources
