. 1997 Apr 7;137(1):231-45.
doi: 10.1083/jcb.137.1.231.

Reversion of the malignant phenotype of human breast cells in three-dimensional culture and in vivo by integrin blocking antibodies

Affiliations

Reversion of the malignant phenotype of human breast cells in three-dimensional culture and in vivo by integrin blocking antibodies

V M Weaver et al. J Cell Biol. .

Abstract

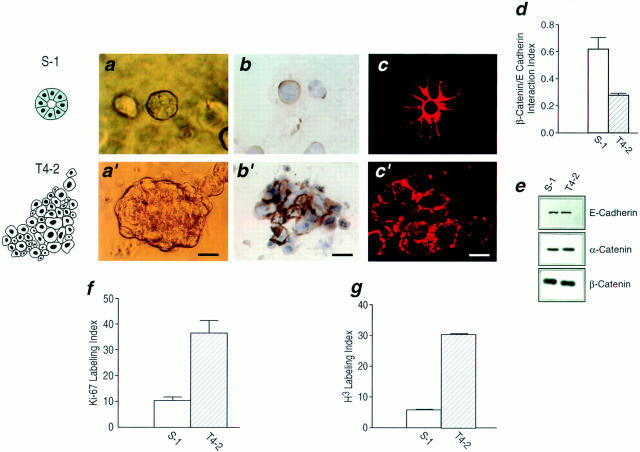
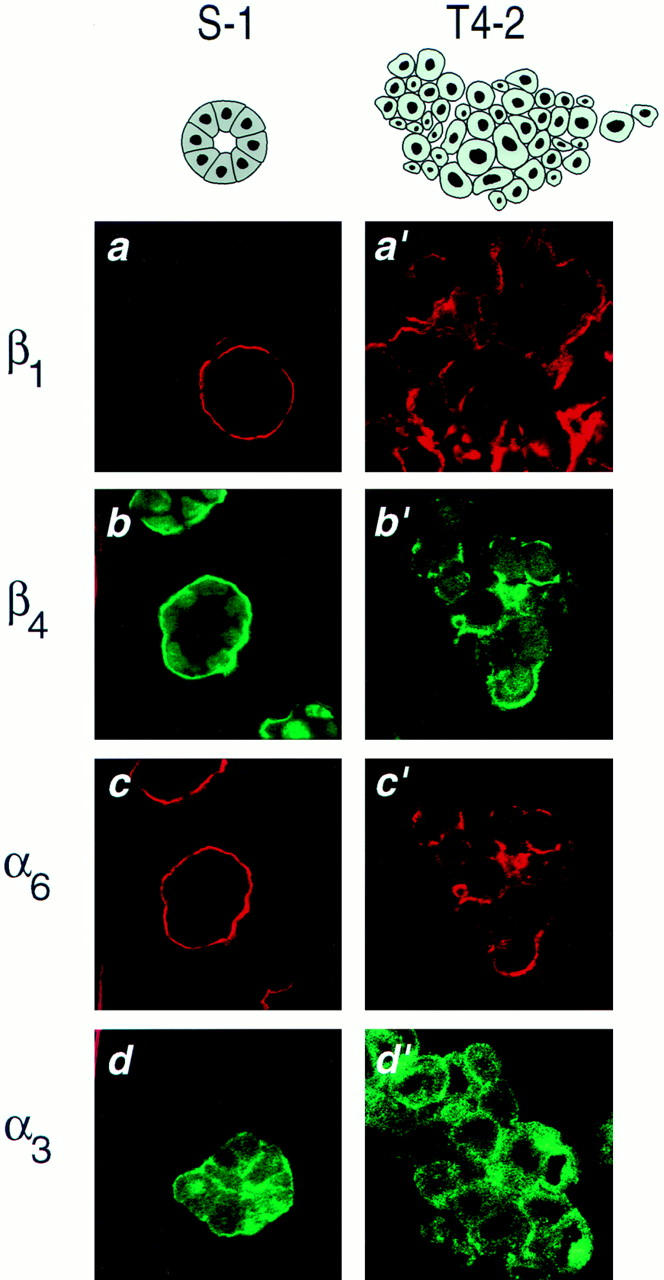
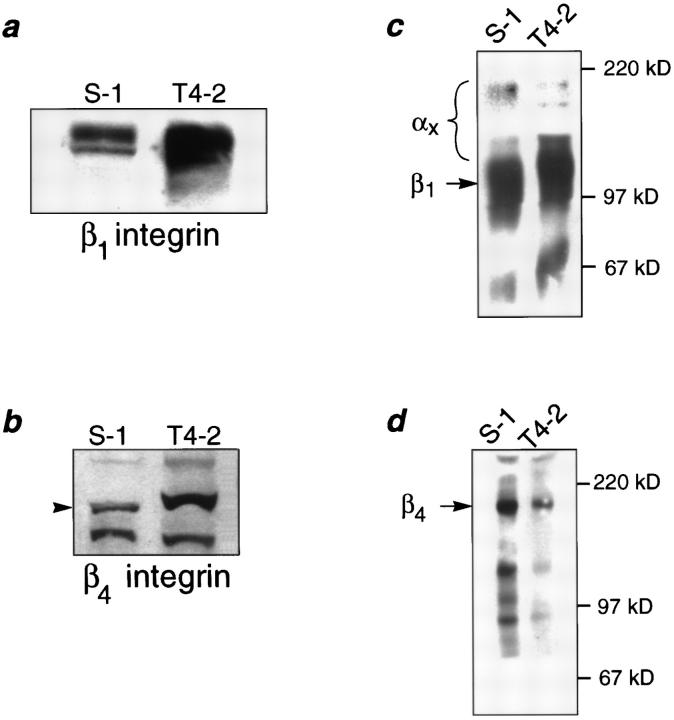
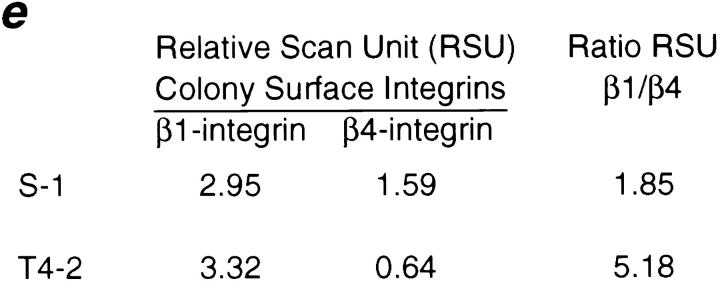
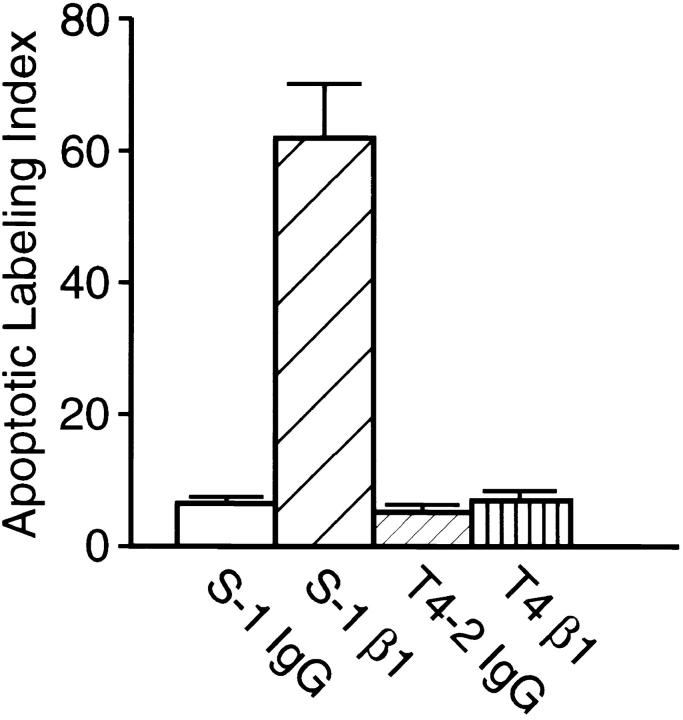
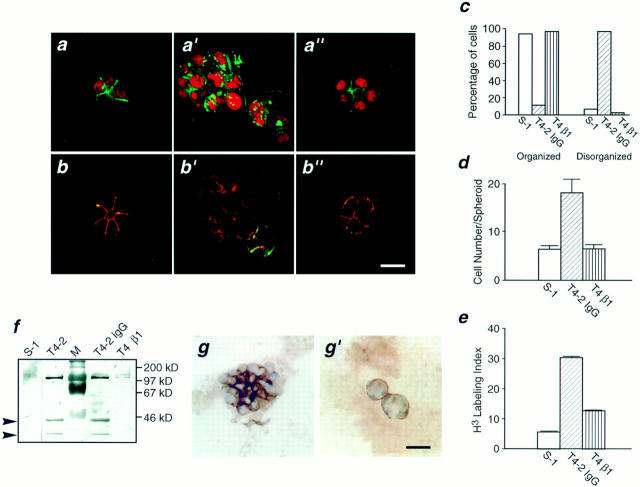
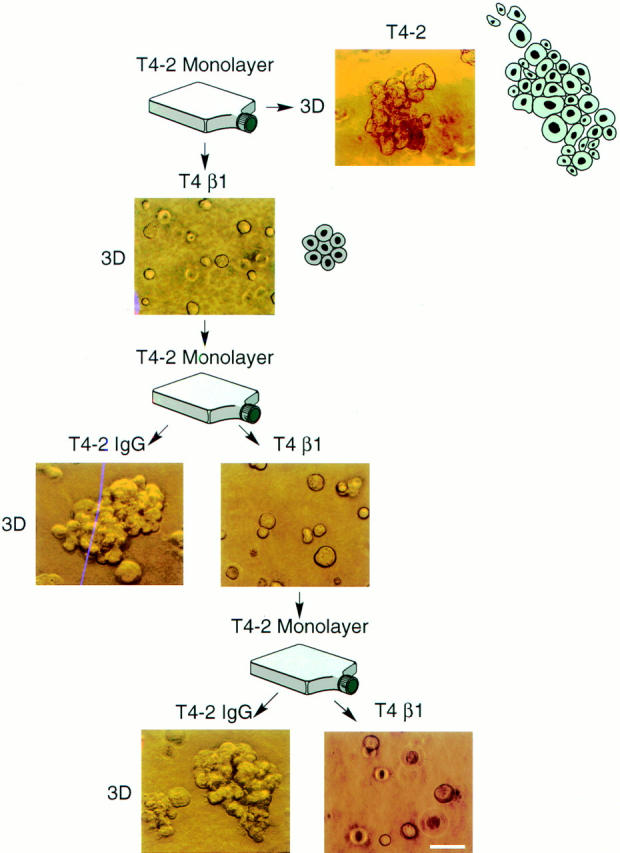
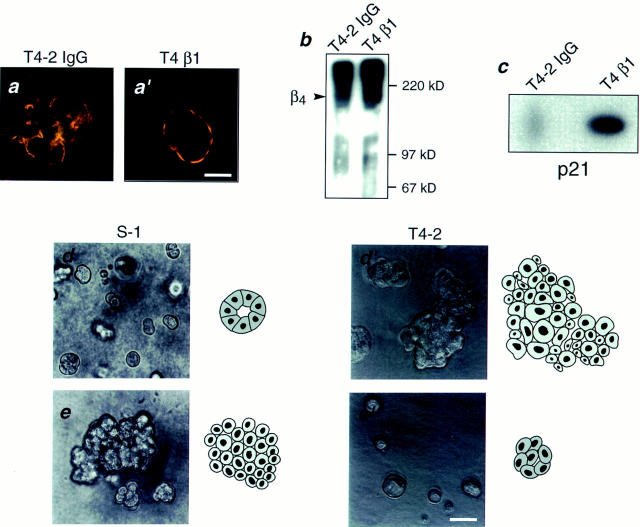
In a recently developed human breast cancer model, treatment of tumor cells in a 3-dimensional culture with inhibitory beta1-integrin antibody or its Fab fragments led to a striking morphological and functional reversion to a normal phenotype. A stimulatory beta1-integrin antibody proved to be ineffective. The newly formed reverted acini re-assembled a basement membrane and re-established E-cadherin-catenin complexes, and re-organized their cytoskeletons. At the same time they downregulated cyclin D1, upregulated p21(cip,wat-1), and stopped growing. Tumor cells treated with the same antibody and injected into nude mice had significantly reduced number and size of tumors in nude mice. The tissue distribution of other integrins was also normalized, suggesting the existence of intimate interactions between the different integrin pathways as well as adherens junctions. On the other hand, nonmalignant cells when treated with either alpha6 or beta4 function altering antibodies continued to grow, and had disorganized colony morphologies resembling the untreated tumor colonies. This shows a significant role of the alpha6/beta4 heterodimer in directing polarity and tissue structure. The observed phenotypes were reversible when the cells were disassociated and the antibodies removed. Our results illustrate that the extracellular matrix and its receptors dictate the phenotype of mammary epithelial cells, and thus in this model system the tissue phenotype is dominant over the cellular genotype.


Figures

Figure 1
Figure 1
Characterization of the HMT-3522 human breast cancer model. (a and a′) Phase contrast micrographs of nonmalignant S-1 cell colonies (a) and tumorigenic T4-2 cell colonies (a′) viewed directly inside EHS for morphology: S-1 cells formed spherical structures reminiscent of true acini (a), whereas T4-2 cells formed large irregular colonies (a′). (b and b′) Immunostaining for basement membrane components: S-1 acini (b) stained for basement membrane proteins at the cell-ECM junctions as expected, while basement membrane deposition in tumor colonies (b′) was clearly disorganized and no longer polarized. Comparable results were obtained for laminin (not shown). (c and c′) Confocal fluorescence microscopy of cryosectioned colonies immunostained for E-cadherin: S-1 acini (c) stained for E-cadherin primarily at the cell–cell junctions as is typically observed in normal breast sections. The T4-2 colonies (c′) showed punctate, dispersed membrane and intracellular staining. (d) The β-catenin–E-cadherin interaction ratio as a measure of adherens junction assembly: There was a 50% decrease in β-catenin protein coprecipitating with E-cadherin in T4-2 cells as compared to S-1 acini. Data are expressed as a ratio of β-catenin to E-cadherin densitometric measurements from duplicates of two separate experiments. Similar results were observed for α-catenin (not shown). (e) Immunoblots of total levels of E-cadherin, α-catenin, and β-catenin: There were comparable levels of all three adherens proteins in S-1 acini and T4-2 colonies. (f and g) Percent of thymidine and Ki-67 labeling in S-1 acini and T4-2 colonies, expressed as thymidine and Ki-67 labeling indices from 3–4 separate experiments: Greater than 90% of the S-1 acini were growth arrested (f), and had exited the cell cycle (g) whereas T4-2 colonies were still actively growing (f) and continued to cycle (g). All cultures were analyzed after 10–12 d inside EHS. Bars: (a and a′) 16 μm; (b and b′) 25 μm; (c and c′) 8 μm.
Figure 2
Figure 2
Immunofluorescence characterization of integrins in the HMT-3522 cells in 3-dimensional cultures. (a–d) Cryosections of S-1 acini and (a′–d′) T4-2 colonies, immunostained and examined by confocal fluorescence microscopy for localization of β1- (a and a′), β4- (b and b′), α6- (c and c′), and α3-integrin (d and d′) localization: β1-, β4-, and α6-integrins were targeted to the cell-ECM junction in the S-1 acini (a–c), in contrast, in T4-2 colonies (a′–c′) this polarized-basal distribution was lost. S-1 acini exhibited basolateral α-3 integrins (d), whereas T4-2 colonies (d) demonstrated disorganized plasma membrane and cytosolic expression of this integrin. All cultures were analyzed after 10–12 d inside EHS. Bars: (a–d and a′–d′) 16 μm.
Figure 3
Figure 3
Biochemical characterization of integrins in the HMT3522 cells after culture in 3-dimensions. (a and b) Western analysis of β1- and β4-integrins: Total cell lysates of S-1 and T4-2 colonies showed elevated expression of β1- (a) and β4-integrins (b) in the tumor cell colonies. (c and d) Cell surface expression of β1- and β4-integrin heterodimers using biotinylation: Tumor colonies had 12.5% higher plasma membrane levels of β1- (c) but 60% lower levels of β4-integrin heterodimers (d) than S-1 acini. (e) Relative scan units (RSU) showing relative colony surface levels of β1- and β4-integrin heterodimers: There was a 2.8-fold relative increase in the ratio of β1-integrins to β4-integrin on the colony cell surface of T4-2 colonies as compared to the S-1 acini. All cells were analyzed after 10–12 d inside EHS.
Figure 3
Figure 3
Biochemical characterization of integrins in the HMT3522 cells after culture in 3-dimensions. (a and b) Western analysis of β1- and β4-integrins: Total cell lysates of S-1 and T4-2 colonies showed elevated expression of β1- (a) and β4-integrins (b) in the tumor cell colonies. (c and d) Cell surface expression of β1- and β4-integrin heterodimers using biotinylation: Tumor colonies had 12.5% higher plasma membrane levels of β1- (c) but 60% lower levels of β4-integrin heterodimers (d) than S-1 acini. (e) Relative scan units (RSU) showing relative colony surface levels of β1- and β4-integrin heterodimers: There was a 2.8-fold relative increase in the ratio of β1-integrins to β4-integrin on the colony cell surface of T4-2 colonies as compared to the S-1 acini. All cells were analyzed after 10–12 d inside EHS.
Figure 4
Figure 4
Apoptosis induction in HMT-3522 cells by inhibitory β1-integrin function blocking antibodies. Apoptotic labeling indices calculated for S-1 and T4-2 cultures treated with inhibitory β1-integrin antibodies for 4 d in 3-dimensional cultures: Greater than 70% of S-1 cells were induced to undergo apoptosis within 4 d of incubation with β1-integrin function blocking antibody (S-1 β1) while the level of basal apoptosis was less than 5% in the isotype controls (S-1 IgG). In contrast T4-2 cells similarly treated (T4 β1) were refractory and had an apoptosis rate comparable to basal levels (T4-2 IgG). Results are the mean and SE of 3–6 separate experiments of duplicates.
Figure 5
Figure 5
β1-inhibitory antibody treatment of tumor cells leads to the formation of reverted acini. (a–a′′) Confocal fluorescence microscopy images of F actin: Both the S-1 (a) and T4-β1 reverted acini (a′′) showed basally localized nuclei (propidium iodide) and organized filamentous F-actin (FITC), while T4-2 mock-treated colonies (T4-2 IgG) had disorganized, hatched bundles of actin and pleiomorphic nuclei (a′). (b–b′′) Confocal immunofluorescence microscopy images of E-cadherin (FITC) and β-catenin (Texas red): In S-1 (b) and T4-β1 reverted acini (b′′), E-cadherin and β-catenins were colocalized and superimposed at the cell–cell junctions. (c) Quantitative analysis of tumor cell conversion efficiency by β1-integrin function blocking antibodies: Greater than 95% of S-1 and T4-β1 colonies were scored as organized, while 97% of T4-2 IgG colonies were considered disorganized. Other reversion criteria, such as scoring for actin and cadherin organization also yielded comparable results (not shown). (d) Cell number per colony in S-1 acini, T4-2 IgG colonies and T4β1 acini from 3–5 experiments: Both S-1 and T4-β1-revertant acini contained 6–8 cells, while T4-2 IgG tumor colonies contained 18–22 cells when scored after 10–12 d (d). (e) Percent of thymidine-labeled cells in S-1, T4-2 IgG, and T4-β1 colonies: While a high percentage of T4-2 IgG colonies (greater than 30%) were still actively growing, the T4-2 β1 revertant acini had a greatly reduced growth rate similar to that observed in the S-1 acini. (f) Immunoblot of cyclin D1 levels in S-1, T4-2, T4-2 IgG, and T4-β1 colonies: The level of D1 cyclin was clearly decreased to the level of S-1 acini after β1 inhibitory antibody treatment. (g and g′) Collagen IV deposition as an indicator of basement membrane organization: T4-β1 reverted acini (g′) deposited an organized collagen IV-containing BM at the cell-ECM junctions, similar to that observed in S-1 acini (see Fig. 1 b). Note the contrast with T4-2 mock–treated tumor colonies (g). (Comparable results were obtained for laminin, not shown.) All cultures were analyzed after 10–12 d inside EHS. Bars: (a–a′′and b–b′′) 16 μm; (g and g′) 25 μm.
Figure 6
Figure 6
Phenotypic reversion as opposed to selection. Phase contrast micrographs of T4-2 cells grown in the presence of anti–β1-integrin function blocking antibody (T4 β1), mock antibody (nonspecific IgG's) (T4-2 IgG) or no antibodies (T4-2) viewed directly inside EHS: Despite two rounds of treatment, these antibody reverted cells were able to resume their original tumorigenic phenotypes when cultured in the absence of antibody. All cultures were analyzed after 10–12 d inside EHS. Bar, 50 μm.
Figure 7
Figure 7
Alteration of α6/β4-integrin signaling in S-1 cells leads to the formation of disorganized colonies. (a and a′) Confocal fluorescence microscopy of double immunostaining for α6- (Texas red) and β4-integrins (FITC): T4-β1 revertant acini (a′) showed basally polarized α6- and β4-integrins, while T4-2 mock–treated (T-4 IgG) colonies (a) demonstrated disorganized, nonpolarized expression. (b) Cell surface expression of β4-integrin heterodimers using biotinylation: Tumor colonies had lower cell surface levels of β4-integrin heterodimers (60% lower) relative to the S-1 acini (see Fig. 3 d), which were restored in the T4-β1 reverted acini (40% higher) relative to the T4-2 colonies. (c) Immunoblot of p21cip,waf-1 levels in T4-2 IgG and T4-β1 colonies: The level of p21 protein was clearly increased in the T4-β1 reverted acini. (d and d′) Phase contrast micrographs of S-1 nonmalignant acini (d) and tumorigenic T4-2 colonies (d′) viewed directly inside EHS: S-1 cells formed spherical structures (d), whereas T4-2 cells formed large, irregular colonies (d′). (e and e′) Phase contrast micrographs of S-1 nonmalignant cells treated with function altering β4-integrin antibodies (e) and tumorigenic T4-2 cells treated with function blocking β1-integrin antibodies (e′) viewed directly inside EHS: S-1 cells treated with β4-integrin antibodies formed large, irregular colonies (e), while T4-2 cells treated with β1-integrin function-blocking antibody (e′) formed spherical structures similar to S-1 acini (see Fig. 1 a). All cultures were analyzed after 10–12 d inside EHS. Bar, 16 μm.

References

    1. Adams JC, Watt FM. Regulation of development and differentiation by the extracellular matrix. Development. 1993;117:1183–1198. - PubMed
    1. Alford D, Taylor-Papadimitriou J. Cell adhesion molecules in the normal and cancerous mammary gland. J Mamm Gland Biol Neo. 1996;1:207–218. - PubMed
    1. Ashkenas J, Muschler J, Bissell MJ. The extracellular matrix in epithelial biology: Shared molecules and common themes in distant phyla. Dev Biol. 1996;180:433–444. - PMC - PubMed
    1. Barcellos-Hoff MH, Aggeler J, Ram TG, Bissell MJ. Functional differentiation and alveolar morphogenesis of primary mammary cultures on reconstituted basement membrane. Development. 1989;105:223–235. - PMC - PubMed
    1. Barsky, S.H., S.A. Doberneck, D.A. Grossman, and S.M. Love. 1994. Recapitulation of carcinoma in situ in axillary nodal breast carcinoma metastasis: clinical and biological implications. Breast Cancer Res.Treat. 32(Suppl): 8.

Publication types

MeSH terms