. 1997 Apr 15;94(8):3789-94.
doi: 10.1073/pnas.94.8.3789.

Disruption of overlapping transcripts in the ROSA beta geo 26 gene trap strain leads to widespread expression of beta-galactosidase in mouse embryos and hematopoietic cells

Affiliations

Disruption of overlapping transcripts in the ROSA beta geo 26 gene trap strain leads to widespread expression of beta-galactosidase in mouse embryos and hematopoietic cells

B P Zambrowicz et al. Proc Natl Acad Sci U S A. .

Abstract

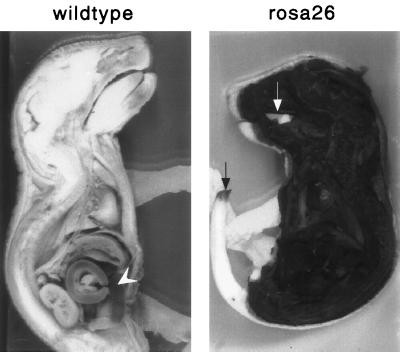
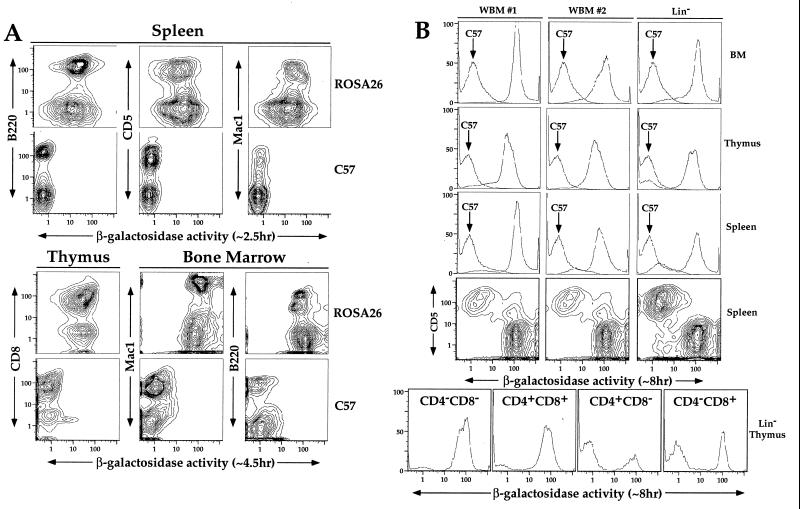
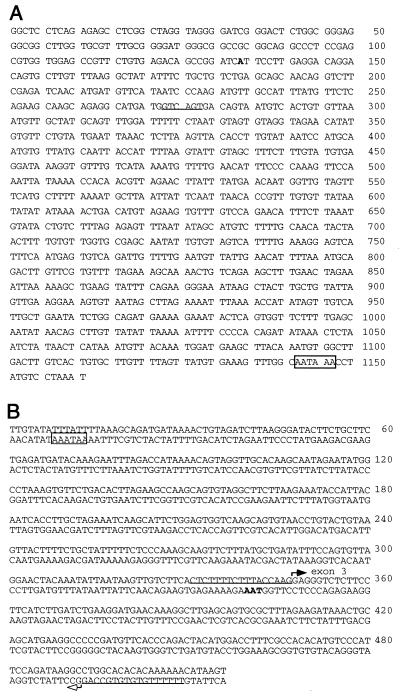
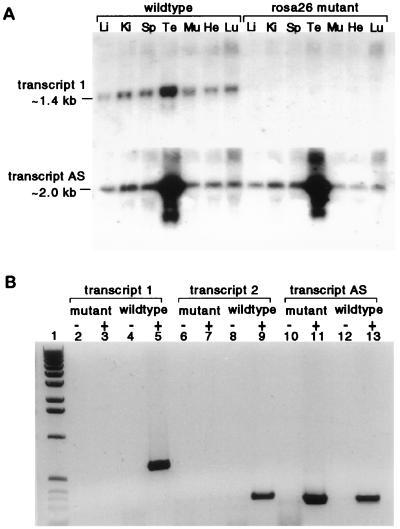
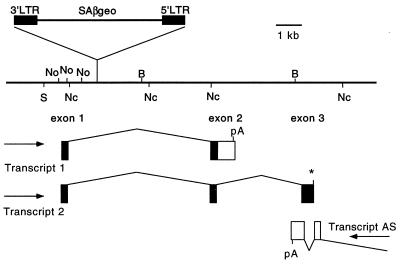
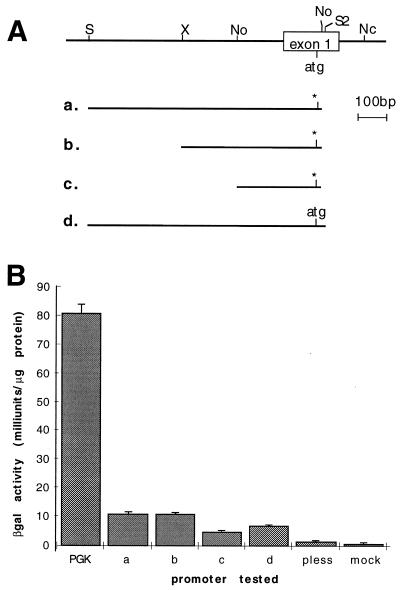
The ROSA beta geo26 (ROSA26) mouse strain was produced by random retroviral gene trapping in embryonic stem cells. Staining of ROSA26 tissues and fluorescence-activated cell sorter-Gal analysis of hematopoietic cells demonstrates ubiquitous expression of the proviral beta geo reporter gene, and bone marrow transfer experiments illustrate the general utility of this strain for chimera and transplantation studies. The gene trap vector has integrated into a region that produces three transcripts. Two transcripts, lost in ROSA26 homozygous animals, originate from a common promoter and share identical 5' ends, but neither contains a significant ORF. The third transcript, originating from the reverse strand, shares antisense sequences with one of the noncoding transcripts. This third transcript potentially encodes a novel protein of at least 505 amino acids that is conserved in humans and in Caenorhabditis elegans.


Figures

Figure 1
Figure 1
Ubiquitous expression of β-gal in newborns. A wild-type (Left) and a heterozygous (Right) newborn were fixed with paraformaldehyde and cross-sectioned prior to X-Gal staining. The arrowhead indicates background staining in the intestines. The white arrow indicates the tongue, in which the mucus membrane prevented penetration of the X-Gal stain. The black arrow shows the depth of X-Gal penetration from the cut surface in the tail. Note that skin makes a good barrier.
Figure 2
Figure 2
Multiparameter FACS-Gal analysis of hematolymphoid organs in ROSA26 mice and mice transplanted with ROSA26 bone marrow. (A) Multiparameter FACS-Gal analysis of adult hematolymphoid organs in ROSA26 homozygous mice. Nucleated cell suspensions from spleen, thymus, and BM of ROSA26 homozygous mice were loaded with FDG, stained with antibody markers specific for certain hematopoietic lineages (B cells, B220; T cells, CD5 or CD8; myeloid cells, Mac1) and analyzed by FACS. To determine background fluorescence in the FACS-Gal assay, fluorescence levels of ROSA26 mice were compared with C57BL/6J controls (contour plots labeled C57 on right). (B) FACS-Gal analysis of C57BL/6J mice transplanted with ROSA26 BM cells. After lethal irradiation, mice were transplanted with either whole BM (WBM #1 or #2) or cells sorted to be negative for a panel of hematolymphoid lineage markers (Lin). Four weeks after irradiation and transplantation, single cell suspensions were prepared from BM, thymus, and spleen of the transplant recipients; loaded with FDG; stained with various antibody markers; and analyzed on the FACS. To assess the degree of reconstitution by the ROSA26 bone marrow cells, the fluorescence histogram of an identically prepared cell suspension from C57BL/6J age-matched mice is denoted by an arrow (C57). To demonstrate that the remaining host cells found in the spleen are T cells (high CD5 expressing cells), we show two-color probability plots for CD5 vs. β-gal staining of splenocytes. To determine which stages of thymocyte development still contain a significant number of host cells, we show FACS-Gal histograms electronically gated for various patterns of CD4 and CD8 expression in the thymus of the mouse reconstituted with Lin cells (Lin Thymus).
Figure 3
Figure 3
ROSA26 sequences. (A) Transcript 1 cDNA. The boldface A indicates the first base of exon 2. The splice donor used in transcript 2 is underlined and the poly(A) addition signal is boxed. (B) Genomic sequences containing the start of exon 3 of transcript 2 (top sequence) and the final exon of transcript AS (bottom sequence). Splice acceptor sites for the two exons are underlined. The start of exon 3 of transcript 2 is indicated by a solid arrow while the start of the final exon of transcript AS is indicated by an open arrow. The stop codon for transcript AS is in boldface type and the poly(A) addition signal for transcript AS is boxed. Note that the sequence between nucleotides 348 and 492 is shared by transcripts 2 and 3 with a sense–antisense relationship.
Figure 4
Figure 4
Effect of the ROSA26 mutation on expression of the three transcripts. (A) Multiple adult tissue RNAs from wild-type and ROSA26 homozygous mutant mice were used on a Northern blot that was probed first for transcript 1 and then for transcript AS. He, heart; Ki, kidney; Li, liver; Lu, lung; Mu, muscle; Sp, spleen; Te, testis. (B) RT–PCR assays were done on adult kidney RNA samples obtained from wild-type or ROSA26 homozygous mutants as indicated. The RT reaction was carried out in the presence (+) or absence (−) of reverse transcriptase and with three different sets of primers that could specifically detect transcripts 1 (lanes 2–5), 2 (lanes 6–9), or 3 (lanes 10–13). The molecular size marker in lane 1 is the 1-kb ladder (GIBCO/BRL).
Figure 5
Figure 5
Map of the ROSA26 genomic region. The line indicates the genomic DNA drawn with the scale and restriction enzyme sites as indicated. The position and orientation of the ROSAβgeo retroviral integration is indicated as are the positions of the exons of the three transcripts that have been mapped. Exons are indicated by rectangles, arrows indicate the direction of transcription of the three transcripts, and lines indicate the splicing patterns for the three transcripts. The 3′ end of exon 2 of transcript 1 and exon 3 of transcript 2 have not yet been determined. B, BglII; Nc, NcoI; No, NotI; S, SalI; pA, poly(A) addition signal.
Figure 6
Figure 6
Characterization of the ROSA26 promoter. (A) Map of the genomic DNA at the 5′ end of exon 1 of transcripts 1 and 2. The relative position of fragments used for promoter activity assay is shown. (a–c) A potential translation start site in exon 1 (atg) has been converted to a BamHI site (asterisk). Nc, NcoI; No, NotI; S, SalI; S2, SacII; X, XhoI. (B) The various promoter fragments (bars a–d) were fused to lacZ, the constructs were electroporated into ES cells, and β-gal activity was assayed. The PGK promoter (PGK) was used as a positive control and no fragment (pless) and mock-transfected cells (mock) were used as negative controls.

References

    1. Gossler A, Zachgo J. In: Gene Targeting: A Practical Approach. Joyner A L, editor. New York: Oxford Univ. Press; 1993. pp. 181–227.
    1. Friedrich G, Soriano P. Genes Dev. 1991;5:1513–1523. - PubMed
    1. MacGregor F R, Zambrowicz B P, Soriano P. Development (Cambridge, UK) 1995;121:1487–1496. - PubMed
    1. Kerr W G, Nolan G P, Serafini A T, Herzenberg L A. Cold Spring Harbor Symp Quant Biol. 1989;54:767–776. - PubMed
    1. Chen Z. Trends Genet. 1996;12:87–88. - PubMed

Publication types