. 1997 Apr 15;94(8):3909-13.
doi: 10.1073/pnas.94.8.3909.

Antigen receptor engagement delivers a stop signal to migrating T lymphocytes

Affiliations

Antigen receptor engagement delivers a stop signal to migrating T lymphocytes

M L Dustin et al. Proc Natl Acad Sci U S A. .

Abstract

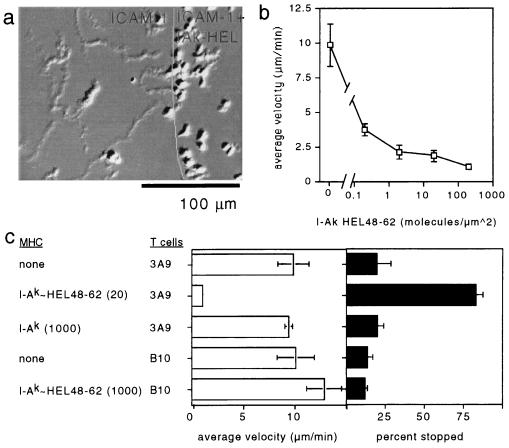
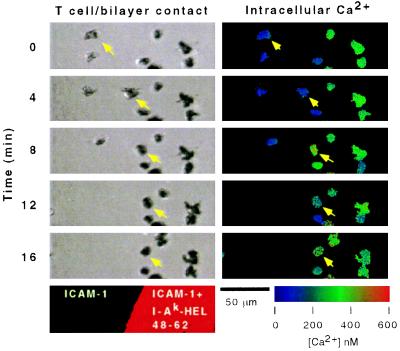
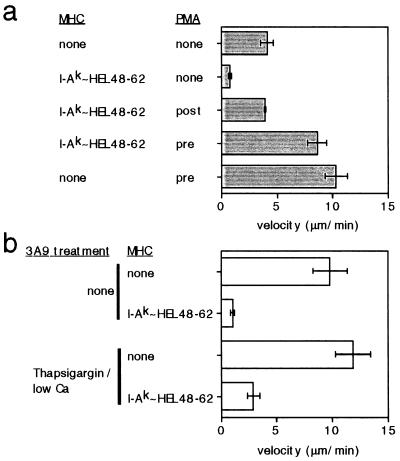
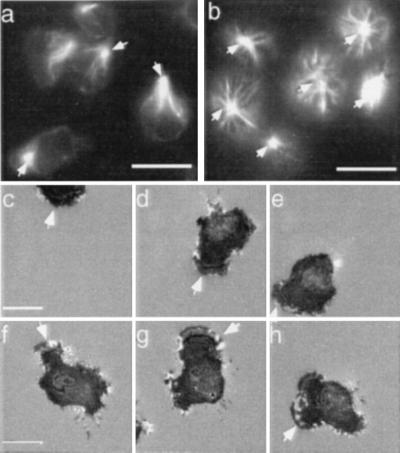
We investigated the role of the T cell antigen receptor (TcR) in control of T cell migration in an in vitro system. We used T cells from transgenic mice bearing a TcR for the lysozyme peptide 48-62 bound to I-A(k) (3A9). T cells from the 3A9 TcR transgenic mice crawled on purified intercellular adhesion molecule-1 substrates, but strikingly, stopped upon interaction with the physiological ligand, i.e., the mouse I-A(k) with covalently attached hen egg white lysozyme peptide residues 48-62 complex. TcR-triggered stopping was reversible by treatment with adhesion-strengthening phorbol esters. The microtubule organizing center of stopped cells was positioned adjacent to the site of stable cell anchorage. Direct conversion of lymphocyte function associated-1 to the high-affinity conformation with antibodies also stopped T cells in a similar manner to antigen. Thus, physiological TcR engagement triggers a stop signal through lymphocyte function associated-1. We propose that the stop signal is an early and essential event in T cell activation that also will play an important role in control of T cell migration.


Figures

Figure 1
Figure 1
Effect of antigen receptor engagement on T cells crawling. (a) Visualization of T cell stopping upon antigen recognition. 3A9 T cells on 800 molecules per μm2 ICAM-1 adjacent to 800 molecules per μm2 ICAM-1 + 20 molecules per μm2 I-Ak–HEL48–62 bilayers over 12-min period. The line indicates the boundary between bilayers. (b) T cell migration velocity on bilayers with ICAM-1 and different densities of I-Ak– HEL48–62. (c) Specificity of the stop signal. The average velocity of crawling including stopped cells (Left) and percentage of cells that did not move 10 μm in 12 min—i.e., stopped cells (Right). Conditions are indicated on left axis. The number in parentheses is the density of the MHC molecules in molecules per μm2. All bilayers contain ICAM-1 at 800 molecules per μm2. T cells were maintained in EL-4 supernatant.
Figure 2
Figure 2
Visualization of 3A9 cell stopping by antigen and Ca2+ mobilization. (Left) Interference reflection microscopy. (Right) Pseudocolor Fura-2 ratio. (Bottom Left) Fluorescence image indicating ICAM-1 secondary bilayer (unlabeled) and ICAM-1 + I-Ak–HEL48–62 containing primary bilayer (labeled). The arrow indicates a cell that crawled from the 800 molecules per μm2 ICAM-1 bilayer onto the 800 molecules per μm2 ICAM-1 + 20 molecules per μm2 I-Ak–HEL48–62 bilayer, stopped at the boundary, and initiated cytoplasmic Ca2+ oscillations.
Figure 3
Figure 3
The stop signal is reversible by adhesion strengthening phorbol esters, but does not require increased cytoplasmic Ca2+. (a) Effect of PMA. 3A9 T cells were treated with 50 ng/ml PMA as indicated: pre indicates 15-min pretreatment before exposure to bilayers, post indicates addition of PMA after cells were exposed to bilayers for 30 min. 3A9 T cells treated with PMA for 1 h had 75% as much TcR on the surface as control cells. Cells were maintained in recombinant IL-2 so the basal migration was slower. Data from three experiments. (b) Effect of cytoplasmic Ca2+ increase. 3A9 T cell migration was examined in normal Ca2+ media or in low Ca2+ media with 500 nM thapsigargin treatment as indicated. These cells had been maintained in the EL-4 supernatant. Data from two experiments. All bilayers have 800 molecules per μm2 of ICAM-1 with or without 20 molecules per μm2 of I-Ak–HEL48–62.
Figure 4
Figure 4
Polarity and contact morphology of 3A9 T cells on physiological ligands. Tubulin immunofluorescence of 3A9 T cells on ICAM-1 at a focal plane 3 μm above the contact (a) or ICAM-1 + 20 molecules per μm2 of I-Ak–HEL48–62 at a focal plane 1 μm above the contact (b). The focal plane for this display was chosen from a series of optical sections for optimal focus of MTOC. Arrowheads indicate MTOC. Interference reflection microscopy on 3A9 cell crawling on ICAM-1 at 30-sec intervals (c–e) or 3A9 cells stopped on ICAM-1 + 20 molecules per μm2 of I-Ak–HEL48–62 (f–h). Arrowheads indicate lamellipodia. (Scale bars = 10 μm.)

References

    1. Sprent J, Miller J F A P, Mitchell G F. Cell Immunol. 1971;2:171–181. - PubMed
    1. Mondino A, Khorutus A, Jenkins M K. Proc Natl Acad Sci USA. 1996;93:2245–2252. - PMC - PubMed
    1. Rowley D A, Gowans J L, Atkins R C, Ford W L, Smith M E. J Exp Med. 1972;136:499–513. - PMC - PubMed
    1. Kalish R S, Johnson K L. J Immunol. 1990;145:3706–3713. - PubMed
    1. Kosaka H, Smith C D, Sprent J. J Exp Med. 1991;176:1291–1302. - PMC - PubMed

Publication types

Substances

LinkOut - more resources