Comparative Study
. 1997 Apr 29;94(9):4312-7.
doi: 10.1073/pnas.94.9.4312.

Hypolipidemic drugs, polyunsaturated fatty acids, and eicosanoids are ligands for peroxisome proliferator-activated receptors alpha and delta

Affiliations
Comparative Study

Hypolipidemic drugs, polyunsaturated fatty acids, and eicosanoids are ligands for peroxisome proliferator-activated receptors alpha and delta

B M Forman et al. Proc Natl Acad Sci U S A. .

Abstract

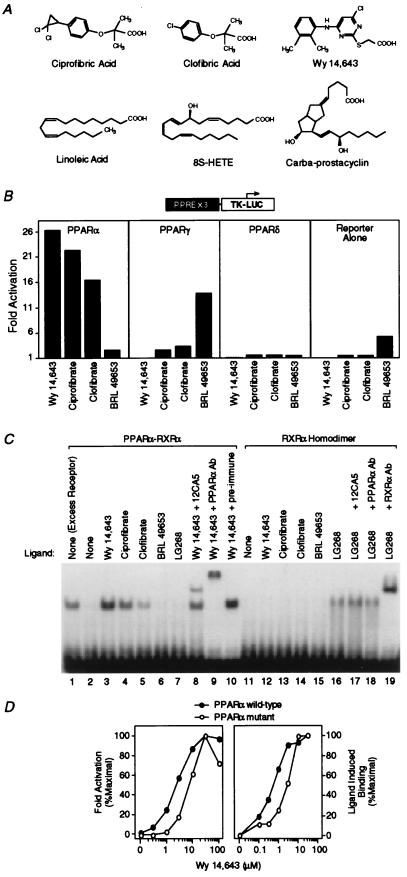
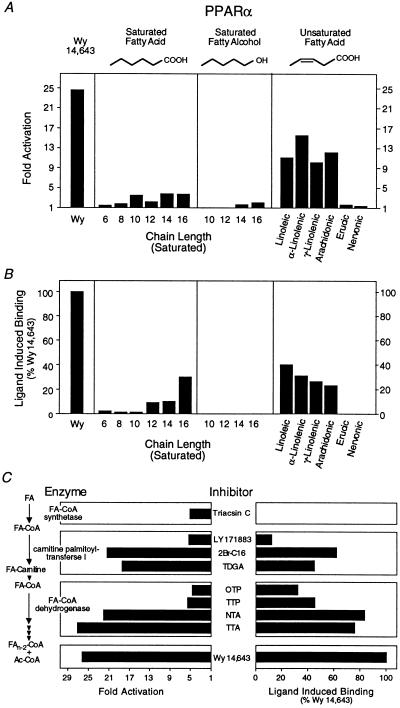
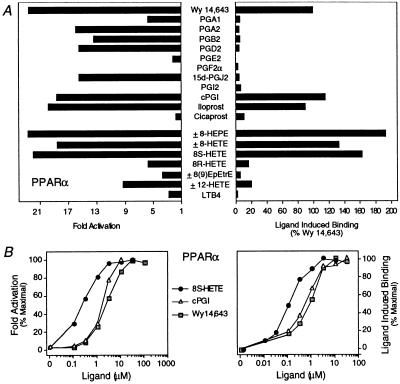
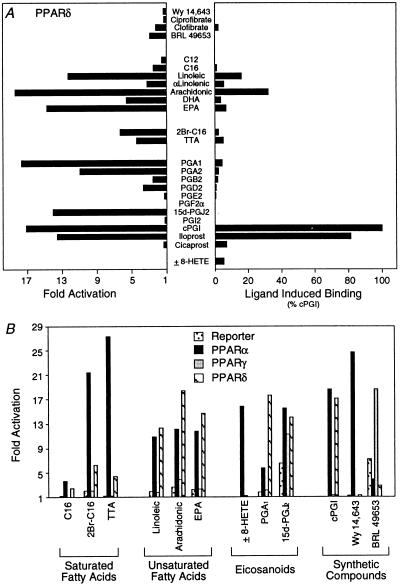
Fatty acids (FAs) and their derivatives are essential cellular metabolites whose concentrations must be closely regulated. This implies that regulatory circuits exist which can sense changes in FA levels. Indeed, the peroxisome proliferator-activated receptor alpha (PPARalpha) regulates lipid homeostasis and is transcriptionally activated by a variety of lipid-like compounds. It remains unclear as to how these structurally diverse compounds can activate a single receptor. We have developed a novel conformation-based assay that screens activators for their ability to bind to PPARalpha/delta and induce DNA binding. We show here that specific FAs, eicosanoids, and hypolipidemic drugs are ligands for PPARalpha or PPARdelta. Because altered FA levels are associated with obesity, atherosclerosis, hypertension, and diabetes, PPARs may serve as molecular sensors that are central to the development and treatment of these metabolic disorders.


Figures

Figure 1
Figure 1
Hypolipidemic fibrates are ligands for PPARα. (A) Chemical structures of some compounds that we demonstrate to be ligands for PPARα or -δ. (B) Fibrates selectively activate PPARα in a cell-based transient transfection assay. Cells were treated with the following concentrations of each compound: 5 μM Wy 14,643, 300 μM ciprofibrate, 300 μM clofibrate, and 1 μM BRL 49653. (C) Fibrates selectively promote binding of PPARα–RXRα heterodimers to labeled DNA in an electrophoretic mobility shift assay. Compounds were added at the following concentrations: 5 μM Wy 14,643, 100 μM ciprofibrate, 1,000 μM clofibrate, 1 μM BRL 49653, and 1 μM LG268. In lane 1 (excess receptor), the amounts of PPARα and RXRα were increased to 0.6 μl and 0.5 μl, respectively. Where indicated, 1 μl of antibody was added to the reaction. (D) Comparison of the dose response profile of wild-type PPARα with PPARα-G (Glu-282 → Gly) (12) in the transient transfection assay (Left) and the LIC assay (Right). The ligand-induced complex was quantified by phosphorimaging analysis. Ligand-induced binding represents the amount of complex produced at any concentration of ligand minus that produced in the absence of ligand. Maximal induced binding was defined to be 100%; binding observed at other concentrations was normalized to this value.
Figure 2
Figure 2
Long-chain FAs and β-oxidation inhibitors are PPARα ligands. (A) Activation of PPARα by FAs and fatty alcohols. All compounds were added to a final concentration of 30 μM except for Wy 14,643, which was used at 5 μM. (B) Enhancement of PPARα–RXRα heterodimer formation by FAs and fatty alcohols. All compounds were added to a final concentration of 30 μM except for Wy 14,643, which was added to a final concentration of 5 μM. Saturated FAs and fatty alcohols are indicated by their chain length. Unsaturated FAs are as follows: linoleic (cis9,12-C18:2), α-linolenic (cis9,12,15-C18:3), γ-linolenic (cis6,9,12-C18:3), arachidonic (cis5,8,11,14-C20:4), erucic (cis13-C22:1), and nervonic (cis15-C24:1) acids. (C) Inhibitors of β-oxidation activation (Left) and bind (Right) to PPARα. Experiments were performed as described in Fig. 1. Triacsin C (10 μM, Left; 30 μM, Right) was used as an inhibitor of fatty LC-FACS. Inhibitors of carnitine palmitoyltransferase I included LY 171883 (30 μM), 2Br-C16 (5 μM), and tetradecylglycidic acid (TDGA, 5 μM). Fatty-acyl-CoA dehydrogenase was inhibited with octylthioproprionic acid (OTP, 30 μM), tetradecylthioproprionic acid (TTP, 30 μM), nonylthioacetic acid (NTA, 30 μM), and tetradecylthioacetic acid (TTA, 30 μM). Wy 14,643 (5 μM) was included as a positive control.
Figure 3
Figure 3
Identification of eicosanoid ligands for PPARα. (A) cPGI, iloprost, 8(S)-HETE, and 8(S)-HEPE transactivate (Left) and bind (Right) to PPARα. For transfections (Left), compounds were added to cells at the following concentrations: 5 μM Wy 14,643; 10 μM PGA1, PGA2, PGB2, PGD2, PGE2, and PGF; 3 μM 15d-J2; 10 μM PGI2; 1 μM cPGI and iloprost; 10 μM cicaprost; 10 μM ±8-HEPE (±8-hydroxy-Δ5Z,9E,11Z,14Z,17Z-C20:5), ±8-HETE (±8-hydroxy-Δ5Z,9E,11Z,14Z-C20:4), ±8(9)-EpEtrE [±8(9)-epoxy-Δ5Z,11Z,14Z-C20:3], and ± 12-HETE (±12-hydroxy-Δ5Z,8Z,10E,14Z-C20:4); 5 μM 8(S)- and 8(R)-HETE; and 10 μM LTB4. For the ligand binding assay (Right), compounds were added as follows: 10 μM Wy 14,643, PGA1, PGA2, PGB2, PGD2, PGE2, PGF, 15d-J2, and PGI2; 2 μM cPGI, iloprost, and cicaprost; 1 μM ±8-HEPE, ±8-HETE, ±8(9)-EpEtrE, and ±12-HETE; 300 nM 8(S)-HETE and 8(R)-HETE; and 10 μM LTB4. (B) Dose-response curves comparing the potency of 8(S)-HETE, cPGI, and Wy 14,643 in transactivating (Left) and binding (Right) to PPARα.
Figure 4
Figure 4
PPARα/δ and -γ display distinct ligand response profiles. (A) Linoelic acid, arachidonic acid, cPGI, and iloprost transactivate (Left) and bind (Right) to PPARδ. After transfection (Left), compounds were added to cells at the following concentrations: 5 μM Wy 14,643; 100 μM ciprofibrate; 1,000 μM clofibrate; 5 μM BRL 49653; 30 μM C12, C16, linoleic acid, α-linoleic, arachidonic, docosahexaenoic (DHA, all-Z-Δ4,7,10,13,16,19-C22:6), and eicosapentaenoic (EPA, all-Z-Δ5,8,11,14,17-C20:5) acids; 5 μM 2Br-C16; 30 μM TTA; 10 μM PGA1, PGA2, PGB2, PGD2, PGE2, and PGF; 3 μM 15d-J2; 10 μM PGI2; 1 μM cPGI and iloprost; 10 μM cicaprost; and 3 μM ±8-HETE. For the ligand binding assay (Right), compounds were added as follows: 5 μM Wy 14,643; 100 μM ciprofibrate; 1,000 μM clofibrate; 50 μM BRL 49653; 30 μM C12, C16, linoleic acid, α-linoleic, arachidonic acids, DHA, and EPA; 10 μM 2Br-C16, TTA, PGA1, PGA2, PGB2, PGD2, PGE2, PGF, 15d-J2, PGI2, cPGI, iloprost, and cicaprost; and 1 μM ±8-HETE. (B) Comparison of the responsiveness of PPARα, -γ, and -δ to various compounds. After transfection, cells were treated with the following concentrations of compounds: 30 μM C16; 5 μM 2Br-C16; 30 μM TTA, linoleic, arachidonic acids, and EPA; 3 μM ±8-HETE; 10 μM PGA1; 3 μM 15d-J2; 1 μM cPGI; and 5 μM Wy 14,643 and BRL 49653.

References

    1. Durrington, P. N. (1993) Postgrad. Med. J. 69, (Suppl 1), S18–S25; discussion S25–S29. - PubMed
    1. Reaven G M. J Intern Med Suppl. 1994;736:13–22. - PubMed
    1. Schoonjans K, Staels B, Auwerx J. Biochim Biophys Acta. 1996;1302:93–109. - PubMed
    1. Issemann I, Green S. Nature (London) 1990;347:645–650. - PubMed
    1. Lee S S T, Pineau T, Drago J, Lee E J, Owens J W, Kroetz D L, Fernandez-Salguero P M, Westphal H, Gonzalez F J. Mol Cell Biol. 1995;15:3012–3022. - PMC - PubMed

Publication types

MeSH terms