Comparative Study
. 1997 Apr 29;94(9):4516-9.
doi: 10.1073/pnas.94.9.4516.

An apportionment of human DNA diversity

Affiliations
Comparative Study

An apportionment of human DNA diversity

G Barbujani et al. Proc Natl Acad Sci U S A. .

Abstract

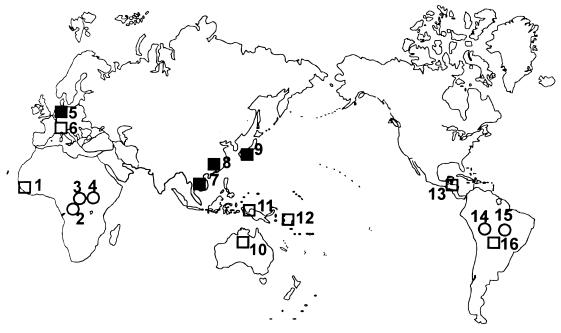
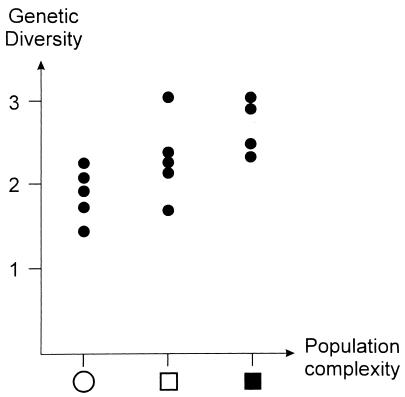
It is often taken for granted that the human species is divided in rather homogeneous groups or races, among which biological differences are large. Studies of allele frequencies do not support this view, but they have not been sufficient to rule it out either. We analyzed human molecular diversity at 109 DNA markers, namely 30 microsatellite loci and 79 polymorphic restriction sites (restriction fragment length polymorphism loci) in 16 populations of the world. By partitioning genetic variances at three hierarchical levels of population subdivision, we found that differences between members of the same population account for 84.4% of the total, which is in excellent agreement with estimates based on allele frequencies of classic, protein polymorphisms. Genetic variation remains high even within small population groups. On the average, microsatellite and restriction fragment length polymorphism loci yield identical estimates. Differences among continents represent roughly 1/10 of human molecular diversity, which does not suggest that the racial subdivision of our species reflects any major discontinuity in our genome.


Figures

Figure 1
Figure 1
Distribution of the samples considered. Samples and sample sizes for the three types of markers (microsatellites, RFLPs, RFLP–individual genotypes) are as follows: 1, Senegalese (0, 0, 28); 2, Mbuti pygmies from Zaire (, 81, 28); 3, Lisongo from Central African Republic (9, 0, 0); 4, Biaka pygmies from Central African Republic (, 67, 27); 5, North Europeans (, 348, 28); 6, Northern Italians (14, 110, 0); 7, Cambodians born in Cambodia sampled in the San Francisco area (, 124, 27); 8, Chinese born in China sampled in the San Francisco area (, 110, 28); 9, Japanese born in Japan sampled in the San Francisco area (, 74, 28); 10, Australians from the Northern Territory (, 35, 15); 11, New Guineans (, 127, 27); 12, Nasioi melanesians from Bougainville, Solomon Islands (, 33, 21); 13, Maya from Yucatan peninsula, Mexico (10, 0, 14); 14, Karitiana from Rondonia, Brazil (10, 0, 0); 15, Suruì from Rondonia, Brazil (10, 0, 0); and 16, mixed Suruì and Karitiana (0, 50, 0). Different symbols refer to the expected levels of population complexity. Open circles, single villages or camps; open squares, groups of villages or localities; and solid squares, entire countries or subcontinental regions.
Figure 2
Figure 2
Within-population diversity, i.e., average pairwise length differences at 30 microsatellite loci (y axis), as a function of population complexity (x axis). For symbols summarizing population complexity, see the legend to Fig. 1.

References

    1. Lewontin R C. Evol Biol. 1972;6:381–398.
    1. Nei M, Roychoudhury A K. Am J Hum Genet. 1974;26:421–443. - PMC - PubMed
    1. Latter B D H. Am Nat. 1980;116:220–237.
    1. Nei M, Roychoudhury A K. Mol Biol Evol. 1993;10:927–943. - PubMed
    1. Ryman N, Chakraborty R, Nei M. Hum Hered. 1983;33:93–102. - PubMed

Publication types

LinkOut - more resources