. 1997 Apr 29;94(9):4554-9.
doi: 10.1073/pnas.94.9.4554.

Defective "pacemaker" current (Ih) in a zebrafish mutant with a slow heart rate

Affiliations

Defective "pacemaker" current (Ih) in a zebrafish mutant with a slow heart rate

K Baker et al. Proc Natl Acad Sci U S A. .

Abstract

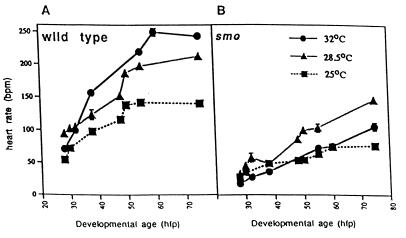
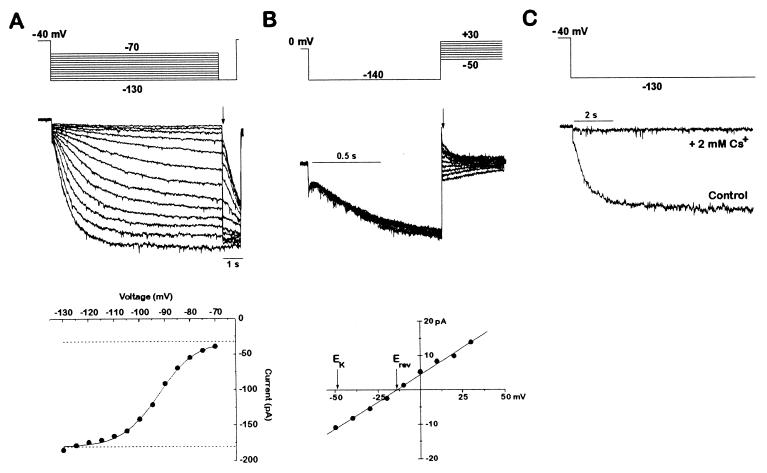
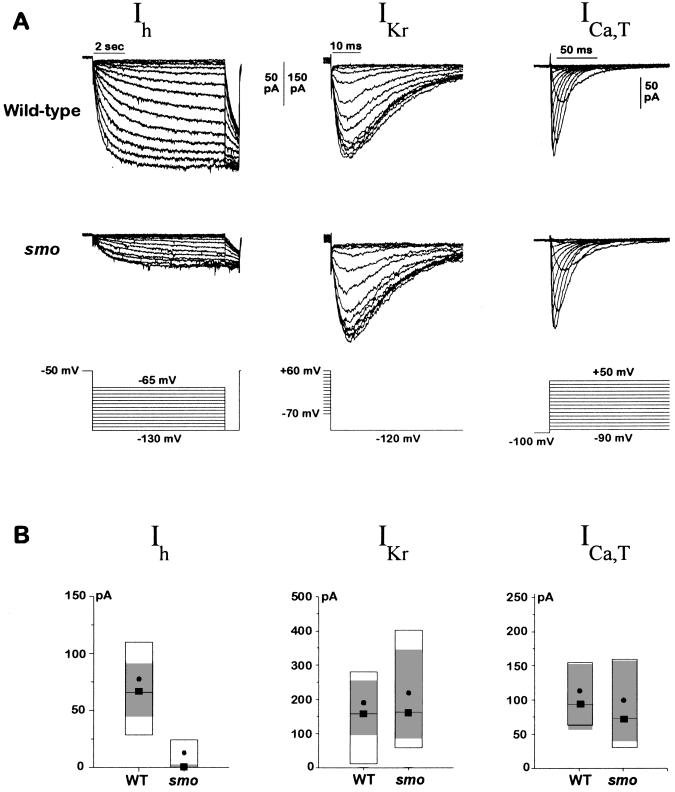
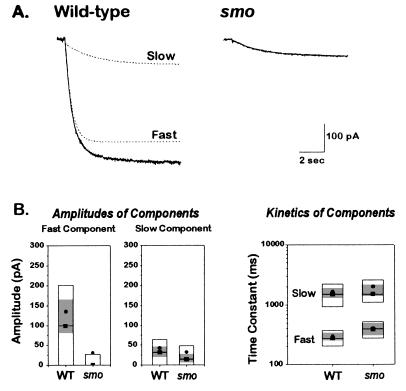
At a cellular level, cardiac pacemaking, which sets the rate and rhythm of the heartbeat, is produced by the slow membrane depolarization that occurs between action potentials. Several ionic currents could account for this pacemaker potential, but their relative prominence is controversial, and it is not known which ones actually play a pacemaking role in vivo. To correlate currents in individual heart cells with the rhythmic properties of the intact heart, we have examined slow mo (smo), a recessive mutation we discovered in the zebrafish Danio rerio. This mutation causes a reduced heart rate in the embryo, a property we can quantitate because the embryo is transparent. We developed methods for culture of cardiocytes from zebrafish embryos and found that, even in culture, cells from smo continue to beat relatively slowly. By patch-clamp analysis, we discovered that a large repertoire of cardiac currents noted in other species are present in these cultured cells, including sodium, T-type, and L-type calcium and several potassium currents, all of which appear normal in the mutant. The only abnormality appears to be in a hyperpolarization-activated inward current with the properties of Ih, a current described previously in the nervous system, pacemaker, and other cardiac tissue. smo cardiomyocytes have a reduction in Ih that appears to result from severe diminution of one kinetic component of the Ih current. This provides strong evidence that Ih is an important contributor to the pacemaking behavior of the intact heart.


Figures

Figure 1
Figure 1
The heart rate in smo homozygotes is slow throughout development and at different temperatures. Heart rates were counted upon visual inspection of unanesthetized embryos developing at room temperature (25°C), our standard aquaculture temperature (28.5°C), or at an elevated temperature (32°C). At least 40 animals were examined for each time point at each temperature. The heart rates of both the wild type siblings (A) and smo mutants (B) rose with developmental stage at all temperatures examined. Smo heart rates were consistently lower than wild type. Additionally, as shown in A, wild type hearts were very responsive to shifts in temperature. The mutant hearts (B), however, had an abnormal decrease in heart rate when raised at 32°C. hpf, hours postfertilization.
Figure 2
Figure 2
A hyperpolarization-activated Ih current is present in zebrafish cardiac myocytes. (A) Activation of Ih current by hyperpolarization. An individual dissociated cardiomyocyte was voltage-clamped from a holding potential of −40 mV to various hyperpolarizing voltages (−70 to −130 mV in 10-mV increments) once every 15 s. Each hyperpolarization was followed by a step to −130 mV to determine the current at a constant voltage. The current amplitude immediately after the voltage step to −130 mV was then plotted as a function of the activation voltage. The data were fitted with a Boltzmann function. The amplitude of the Ih current was given by the net amplitude of the Boltzmann function. The leak current was determined by the baseline of the fit and was not part of the Ih determination. Current traces were filtered at 1 kHz. (B) Tail current analysis of the Ih reversal potential. After Ih was activated for 1 s by a step from 0 mV to −130 mV, another step was applied to a new voltage (from −50 to +30 mV in 10-mV increments). The tail current amplitude immediately after the voltage clamp settled is plotted as a function of the tail current voltage. The tail currents reversed at −14 mV, as determined by the line fitted to the data points. A perfectly potassium-selective channel would have a reversal potential of −49 mV in the solutions used. The dihydropyridine niguldipine (1 μM) was included to block the calcium currents present in these cells. If the cell was held at 0 mV and not hyperpolarized to activate the Ih current, no tail currents were observed (data not shown). Current traces were filtered at 2 kHz. The voltage protocol was delivered once every 4 s. (C) Inhibition of Ih by cesium. Ih currents with and without 2 mM CsCl applied extracellularly, in response to a step from −40 mV to −130 mV. Current traces were filtered at 1 kHz.
Figure 3
Figure 3
Ih is reduced in smo cardiac myocytes. (A) Representative Ih, IKr, and ICa,T currents from wild-type and smo cells. Ih was elicited from a holding voltage of −50 mV by steps to various voltages (−65 to −130 mV in 5-mV increments). A test voltage of −130 mV was applied at the end of each hyperpolarizing step. IKr was activated by a ≈1-s prepulse to various voltages (+60 to −70 mV in 10-mV increments); the inwardly rectifying current was then measured at a constant test voltage of −120 mV. ICa,T was elicited from a holding potential of −100 mV to voltages ranging from −90 to +50 mV once every 2 s. Current traces were filtered at 1 kHz (Ih) or 5 kHz (IKr and ICa,T). (B) Amplitude of Ih, IKr, and ICa, T currents from many wild-type and smo cells. The data are displayed as box plots. The box delimits the central 50% of the data values. The median is shown as a solid line tagged with a solid box, and the mean is shown as a solid circle. The 99% confidence interval for a robust median is shown by the gray shaded zone. The confidence interval is based on the biweight locator and estimate of scale (25). Boxplots of the Ih current amplitudes are shown for wild-type (n = 47) and smo (n = 48) cells. Boxplots of the IKr current amplitudes also are shown for wild-type (n = 31) and smo (n = 23) cells and for ICa,T, wild-type (n = 20), and smo (n = 20) cells. The size of whole cell Ih currents in smo cells was very small (average 12.0 pA), making it difficult to fit some of the data to a Boltzmann function. The amplitude comparison between wild-type and smo cells was thus repeated but with recording conditions that were chosen to enhance the amplitude of the Ih currents. The bath solution was as described in Materials and Methods except that KCl was increased to 140 mM, 2 mM BaCl2 was added, and NaCl was omitted. The pipette solution was supplemented with 100 μM cAMP. The Ih current amplitude was indeed enhanced 2.5-fold by the changes in recording solutions, and the effects of the smo mutation on the Ih current were the same. For the Ih current, the confidence interval was 110–260 pA in wild-type cells (n = 19) compared with 5–44 pA in smo cells (n = 20). IKr current was again unchanged by the mutation: 99% confidence interval was 67–358 pA for wild-type (n = 20) and 109–261 pA for smo cells (n = 19). The reduction in Ih current in smo cells was not due to a difference in cell size between wild-type and smo because the cell capacitances were the same for the two genotypes; the 99% confidence interval on the robust median for wild-type (n = 34) was 2.3–3.2 pF and for smo (n = 28) was 2.4–3.1 pF. Data were obtained for both Ih and IKr from each cell whenever possible. The amplitude of the Ih current was determined as shown in Fig. 2A from the amplitude of the Boltzmann fit, and the amplitude of the IKr current was determined in an analogous fashion. The current amplitude for ICa,T was determined at −20 mV after leak subtraction. The leak current and nonlinear open channel properties were minimized for both the Ih and IKr records by taking all of the current amplitudes at a constant voltage. For each value in the legend, we report a range of numbers giving the 99% confidence interval for the robust median. WT, wild-type.
Figure 4
Figure 4
The reduced Ih current in smo cells is due to the reduction of a fast component normally seen in wild type. (A) Representative Ih currents from a wild type and a smo cell in response to a step from −40 to −130 mV. Ih currents were recorded using the solutions noted in the Fig. 3 legend. The wild type current trace was fit with a sum of two exponentials; the individual exponential components are shown in the dashed lines, and their sum lies on top of the current trace. The smo current was well described by a single exponential. (B) Amplitude and kinetic analysis of wild type and smo Ih currents. Wild type Ih currents (from 68 cells) were fitted with two exponentials (Fast and Slow); the amplitude and time constant for each component are displayed separately. smo Ih currents (from 65 cells) were fitted with either one or two exponentials (Fast and Slow); the amplitude and time constant for each component are displayed separately. The amplitude of the fast component is markedly reduced in smo cells. The kinetics of both the fast and slow components are similar. The shaded area in each box shows the 99% confidence interval about the robust median. WT, wild type.

References

    1. Hagiwara N, Irisawa H, Kameyama M. J Physiol (London) 1988;395:233–253. - PMC - PubMed
    1. Noma A, Morad M, Irisawa H. Pflugers Arch. 1983;397:190–194. - PubMed
    1. Campbell D L, Rasmusson R L, Strauss H C. Annu Rev Physiol. 1992;54:279–302. - PubMed
    1. Irisawa H, Brown H F, Giles W. Physiol Rev. 1993;73:197–227. - PubMed
    1. DiFrancesco D. J Physiol (London) 1991;434:23–40. - PMC - PubMed

Publication types

LinkOut - more resources