

Evolution of the primate lineage leading to modern humans: phylogenetic and demographic inferences from DNA sequences
- PMID: 9114074
- PMCID: PMC20807
- DOI: 10.1073/pnas.94.9.4811
Evolution of the primate lineage leading to modern humans: phylogenetic and demographic inferences from DNA sequences
Abstract
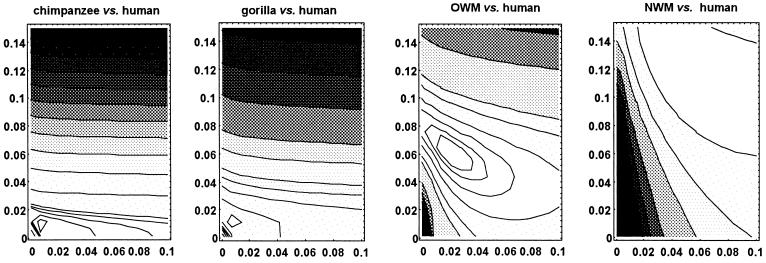
To date major divergences that occurred in the primate lineage leading to modern humans and to infer a demographic parameter (effective population size) of the ancestral lineage that existed at each divergence, a maximum likelihood method was applied to autosomal DNA sequence data currently available for pairs of orthologous genes between the human and each of the chimpanzee, gorilla, Old World monkey (OWM), and New World monkey (NWM). A statistical test is carried out to support the assumption that silent substitutions have accumulated in a clock-like fashion over loci between primate taxa or even among sites within a locus. It is shown that the human ancestral lineage became distinct from the NWM 57.5 million years (Myr) ago, the OWM 31 Myr ago, the gorilla 8.0 Myr ago, and the chimpanzee 4.5 Myr ago, and that the effective population size at these divergences was generally much greater than that of modern humans. It is argued that the human ancestral lineage branched off from the NWM and OWM earlier than once thought and that significant demographic changes might have occurred at different evolutionary stages, particularly at the hominid stage.
Figures
References
Publication types
MeSH terms
LinkOut - more resources
Full Text Sources
