. 1997 Mar 3;185(5):855-66.
doi: 10.1084/jem.185.5.855.

Granzyme B (GraB) autonomously crosses the cell membrane and perforin initiates apoptosis and GraB nuclear localization

Affiliations

Granzyme B (GraB) autonomously crosses the cell membrane and perforin initiates apoptosis and GraB nuclear localization

L Shi et al. J Exp Med. .

Abstract

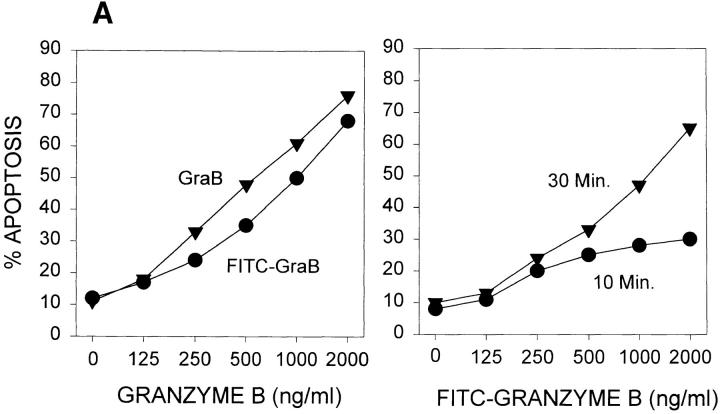
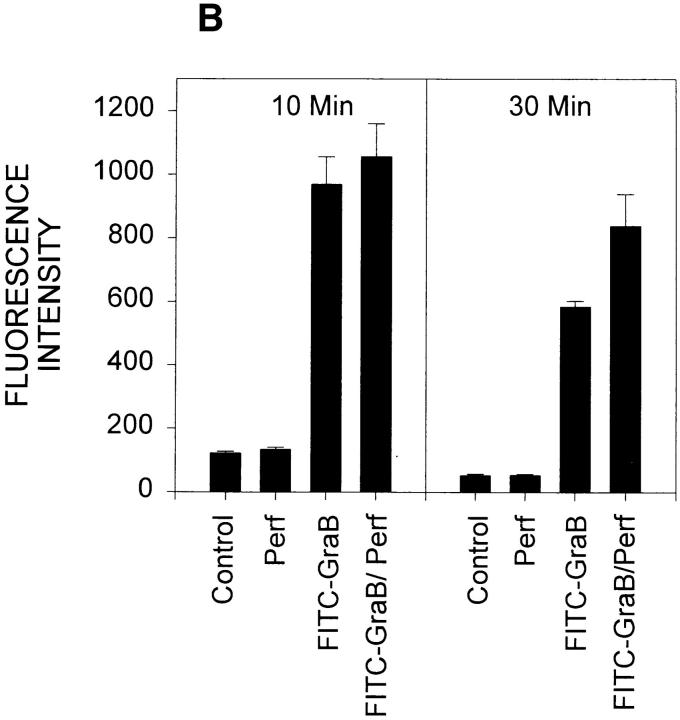
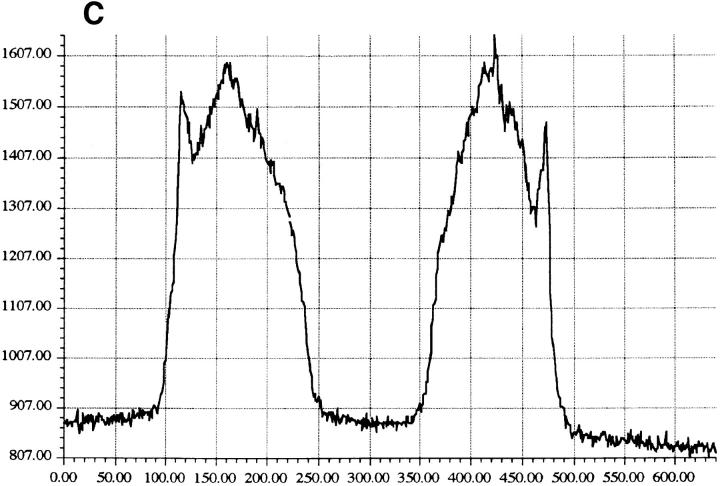
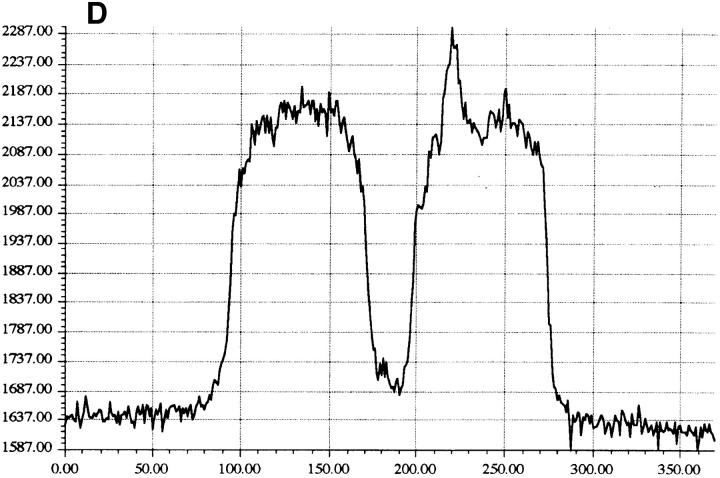
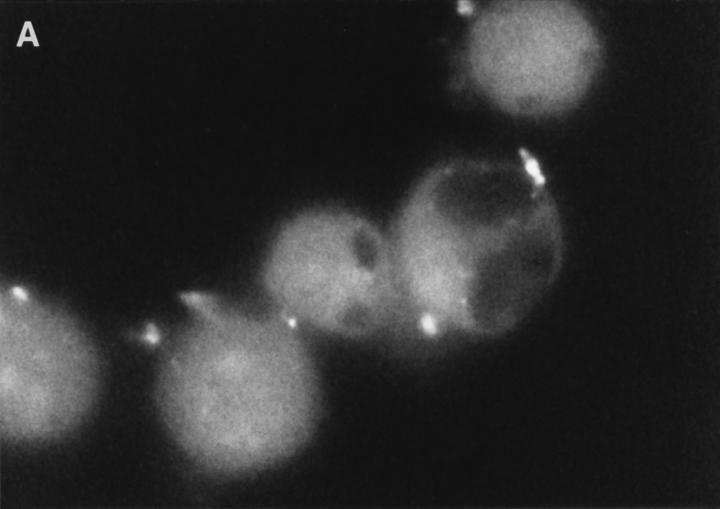
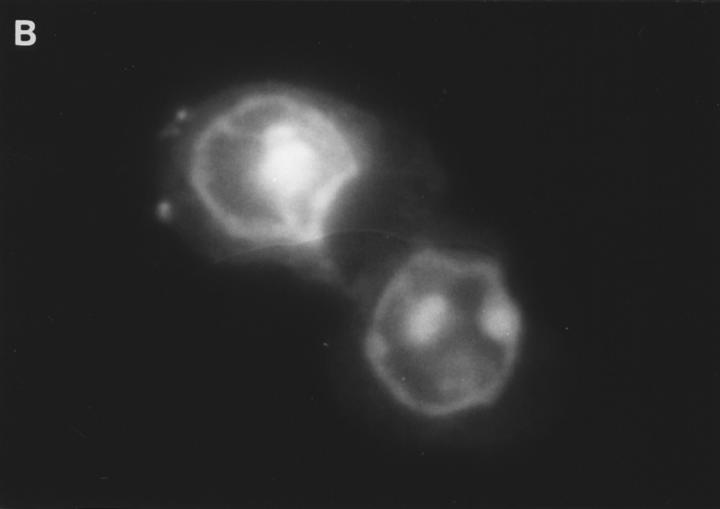
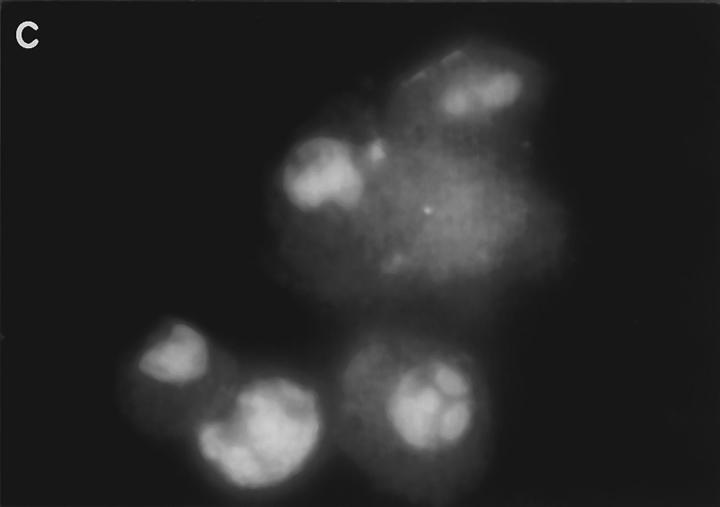
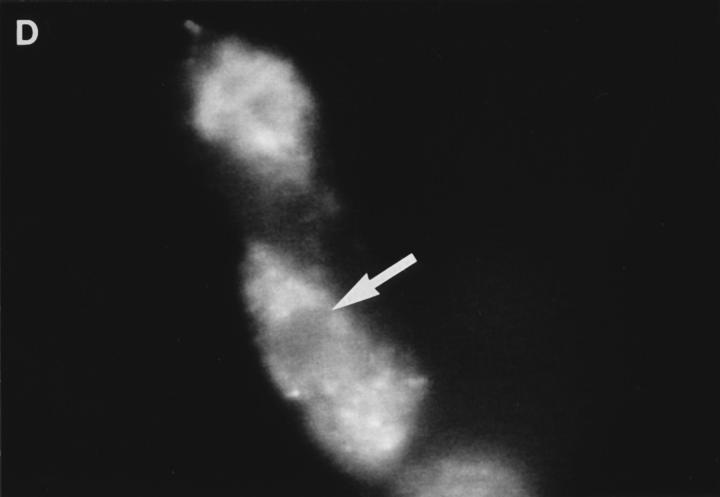
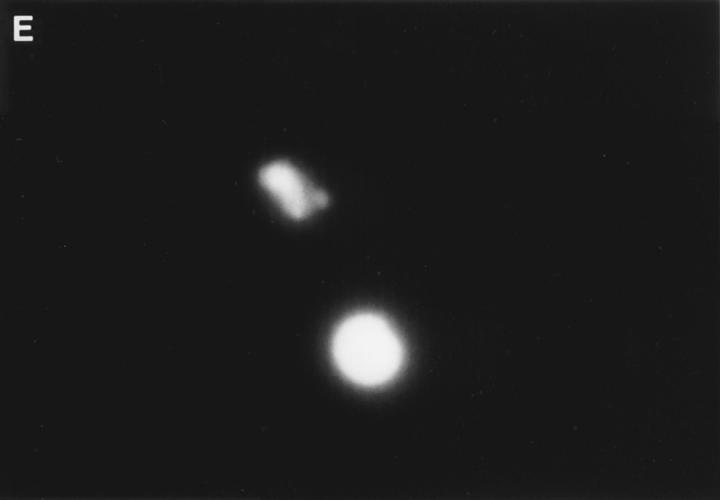
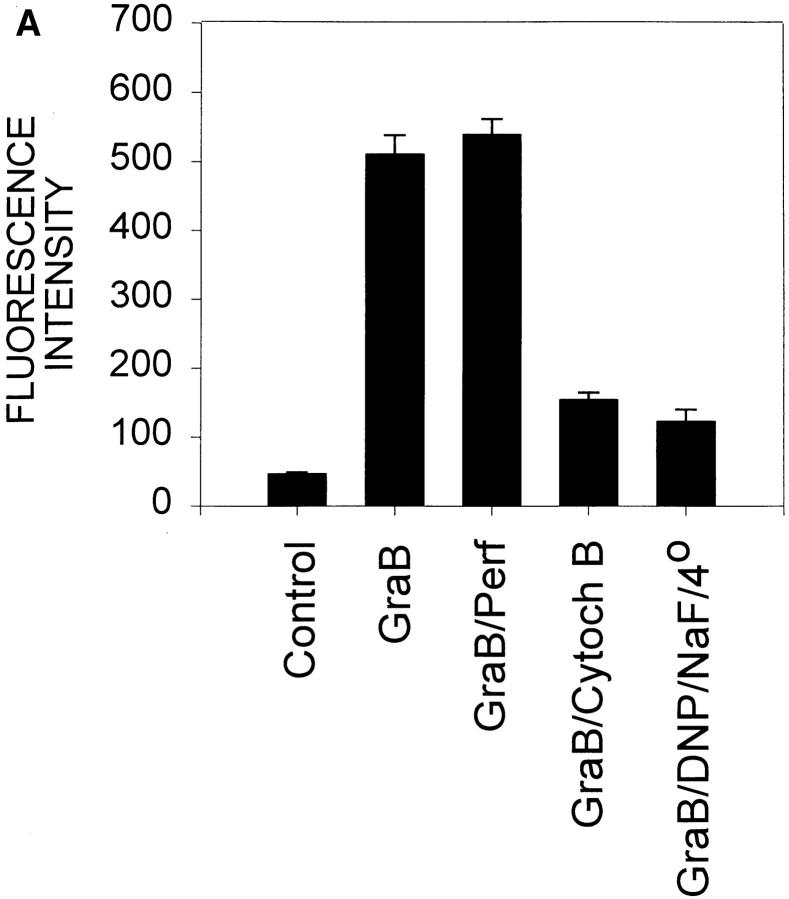
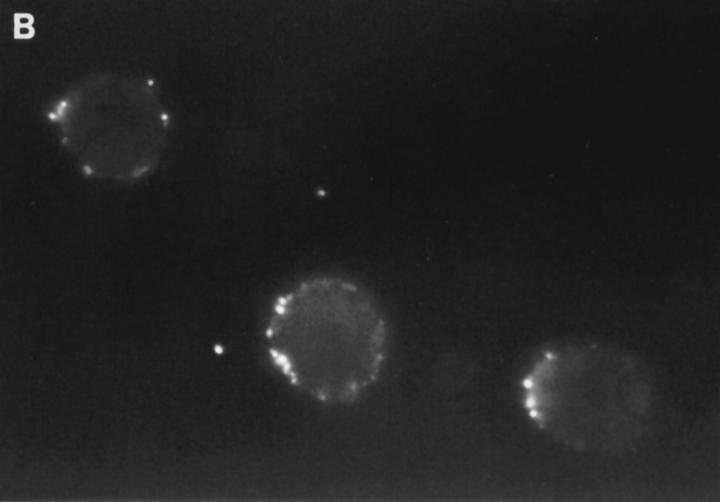
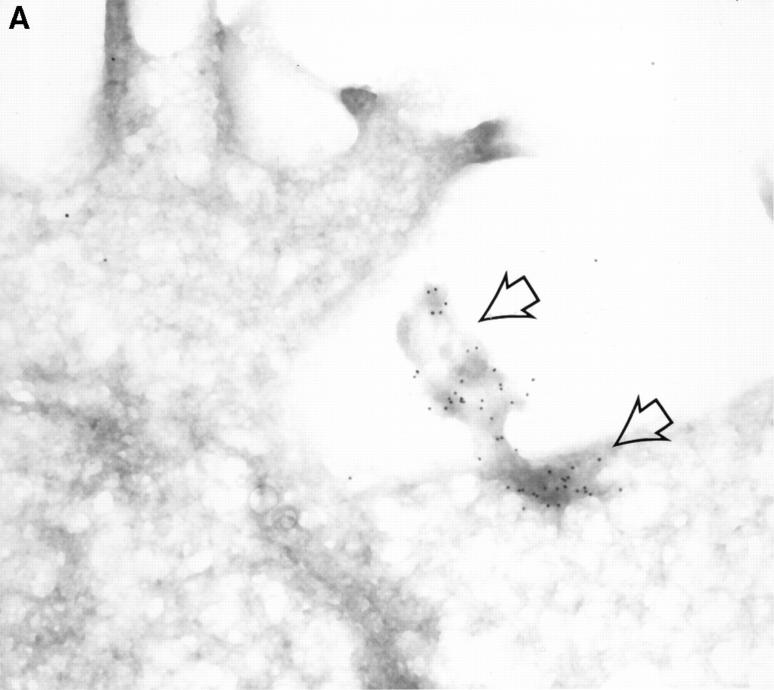
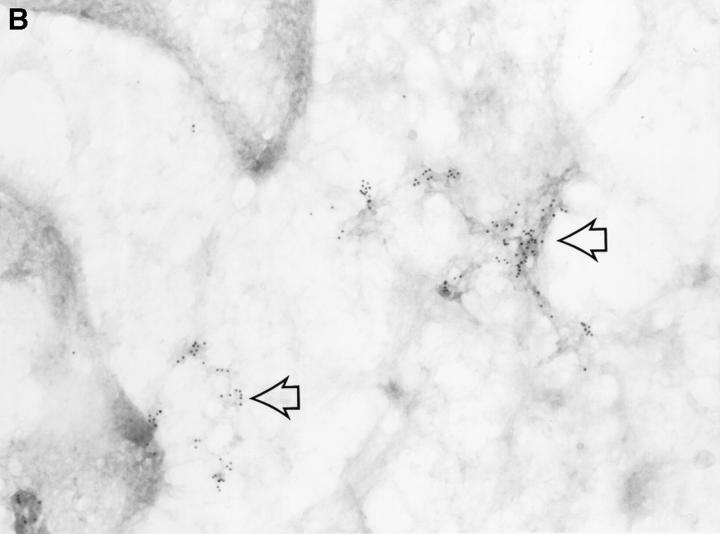
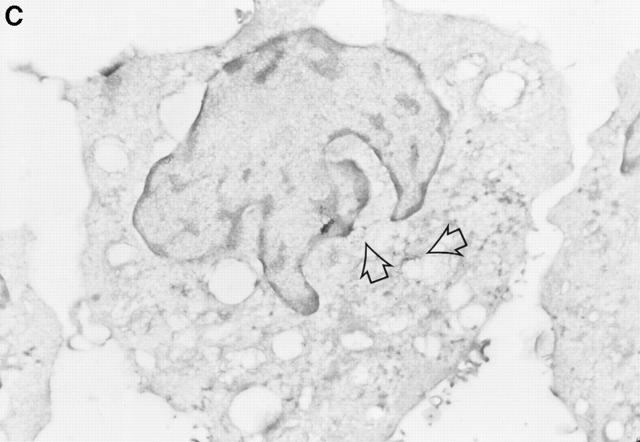
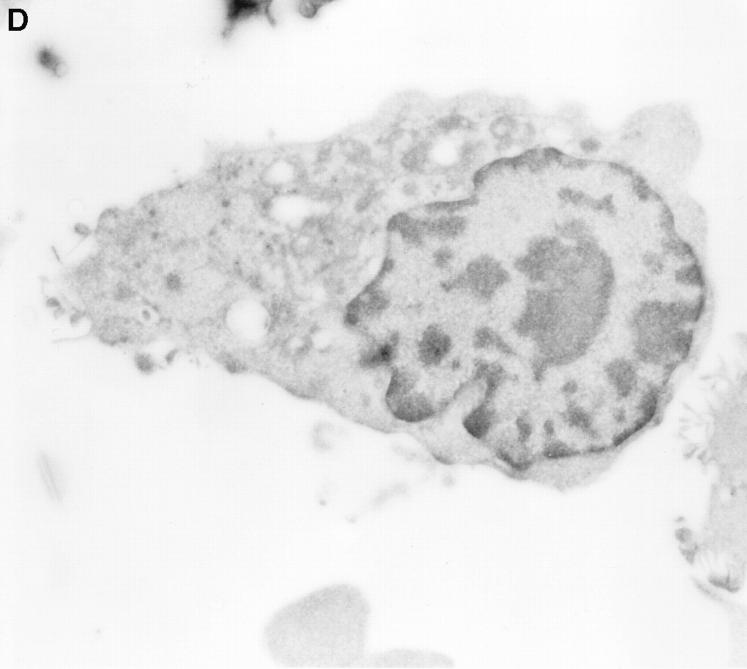
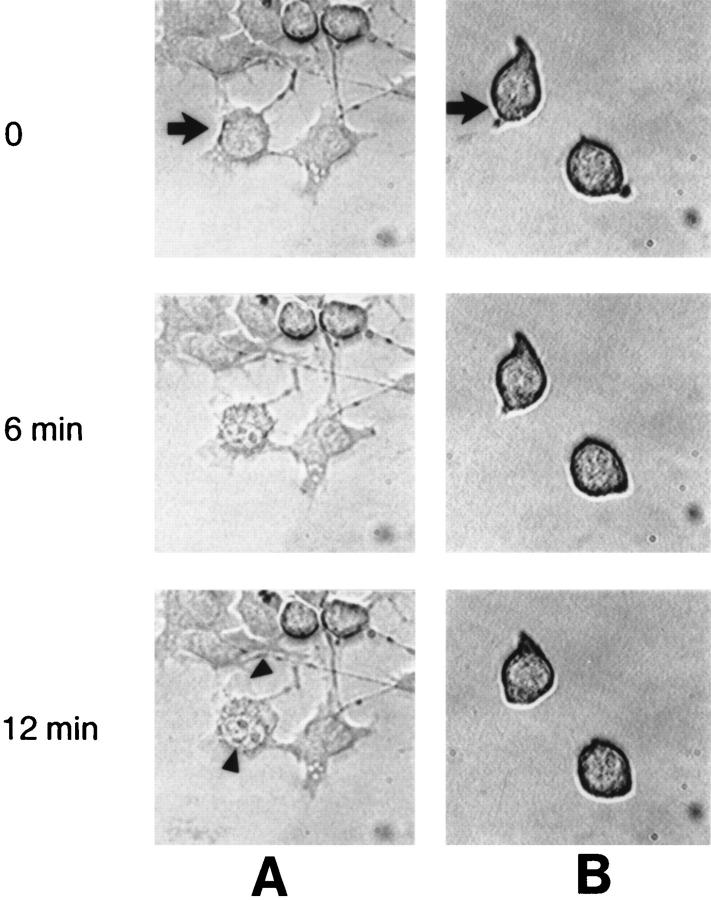
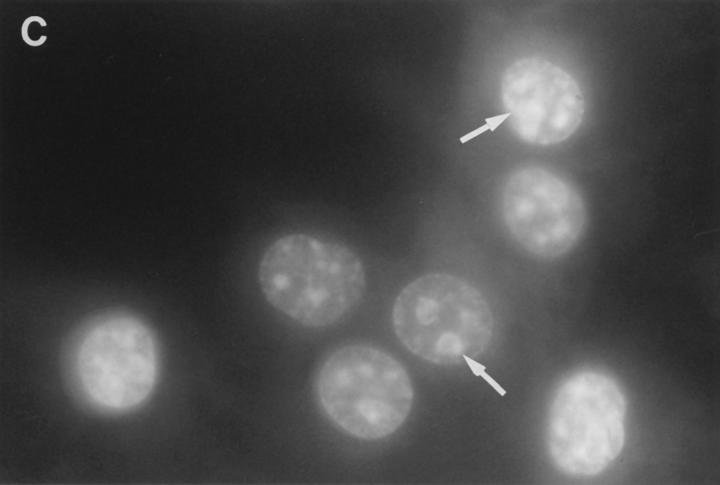
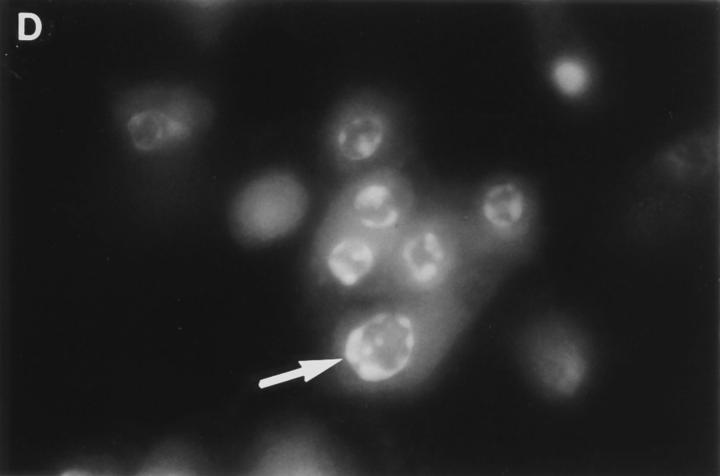
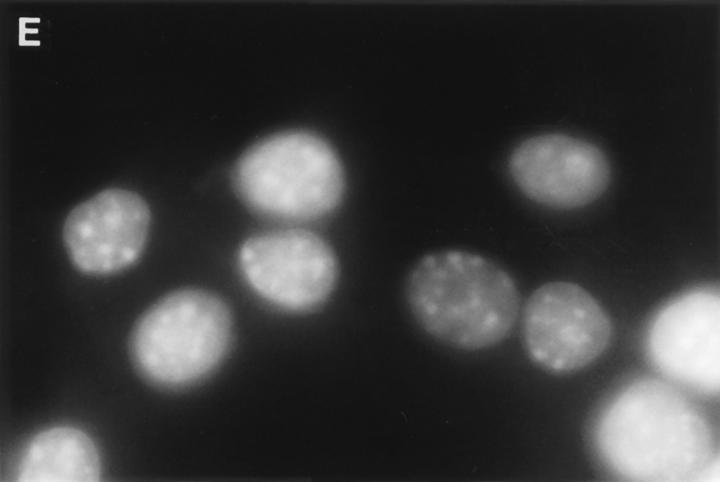
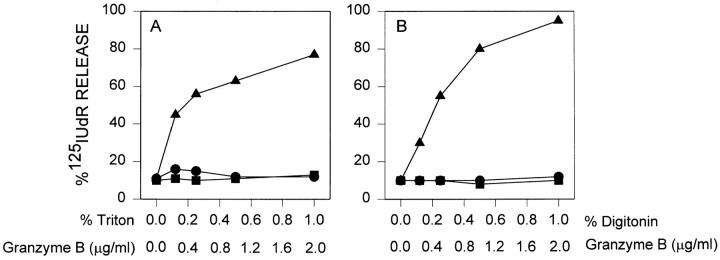
Granzyme B (GraB) induces apoptosis in the presence of perforin. Perforin polymerizes in the cell membrane to form a nonspecific ion pore, but it is not known where GraB acts to initiate the events that ultimately lead to apoptosis. It has been hypothesized that GraB enters the target cell through a perforin channel and then initiates apoptosis by cleaving and activating members of the ICE/Ced-3 family of cell death proteases. To determine if GraB can enter the cell, we treated YAC-1 or HeLa cells with FITC-labeled GraB and measured intracellular fluorescence with a high sensitivity CCD camera and image analyzer. GraB was internalized and found diffusely dispersed in the cell cytoplasm within 10 min. Uptake was inhibited at low temperature (4 degrees C) and by pretreatment with metabolic inhibitors, NaF and DNP, or cytochalasin B, a drug that both blocks microfilament formation, and FITC-GraB remained on the cell membrane localized in patches. With the simultaneous addition of perforin and FITC-GraB, no significant increase in cytoplasmic fluorescence was observed over that found in cells treated only with FITC-GraB. However, FITC-GraB was now detected in the nucleus of apoptotic cells labeling apoptotic bodies and localized areas within and along the nuclear membrane. The ability of GraB to enter cells in the absence of perforin was reexamined using anti-GraB antibody immunogold staining of ultrathin cryosections of cells incubated with GraB. Within 15 min, gold particles were detected both on the plasma membrane and in the cytoplasm of cells with some gold staining adjacent to the nuclear envelope but not in the nucleus. Cells internalizing GraB in the absence of perforin appeared morphologically normal by Hoechst staining and electron microscopy. GraB directly microinjected into the cytoplasm of B16 melanoma cells induced transient plasma membrane blebbing and nuclear coarsening but the cells did not become frankly apoptotic unless perforin was added. We conclude that GraB can enter cells autonomously but that perforin initiates the apoptotic process and the entry of GraB into the nucleus.


Figures

Figure 1
Figure 1
Cytoplasmic uptake of FITC-GraB. (A, left) Apoptosis of YAC-1 cells comparing GraB (filled triangles) to FITC-labeled GraB (filled circles)with a constant amount of perforin (125 ng/ml). Apoptosis was measured by the release of 125IUdR and the results are expressed as percentage of total label incorporated into the target cells. (Right) Apoptosis of YAC-1 cells by increasing concentrations of FITC-GraB in the presence of perforin (125 ng/ml) incubated for 10 min (filled circles) or 30 min (filled triangles) as indicated. Apoptosis was measured by the condensation of chromatin visualized by Hoechst staining. (B) Quantitation of fluorescence label in YAC-1 cells treated with FITC-GraB (GraB) with or without perforin (Perf). Cells were incubated in 1 μg/ml of FITC-GraB for 10 or 30 min then fixed and visualized with a CCD camera. Intracellular fluorescence was quantitated using an IPLabs Spectrum H-SU2 image analysis program. At least 30 cells were measured for each condition and the difference between extracellular and a maximum plateau of intracellular fluorescence calculated and scored. Data is expressed as the mean and SEM. The experiment was repeated several times with YAC-1 or HeLa cells with the same result. (C) Fluorescence of two YAC-1 cells treated for 30 min with FITC-GraB and analyzed using an IPLabs Spectrum image analysis program. Intracellular fluorescence was calculated for each cell by the difference between the background surrounding the cell and the mean peak of intracellular fluorescence on the y-Axis. (D) Image analysis of two cells treated with FITC-GraB and perforin for 30 min. (E) Image analysis of the autofluorescence of two YAC-1 cells used as background.
Figure 1
Figure 1
Cytoplasmic uptake of FITC-GraB. (A, left) Apoptosis of YAC-1 cells comparing GraB (filled triangles) to FITC-labeled GraB (filled circles)with a constant amount of perforin (125 ng/ml). Apoptosis was measured by the release of 125IUdR and the results are expressed as percentage of total label incorporated into the target cells. (Right) Apoptosis of YAC-1 cells by increasing concentrations of FITC-GraB in the presence of perforin (125 ng/ml) incubated for 10 min (filled circles) or 30 min (filled triangles) as indicated. Apoptosis was measured by the condensation of chromatin visualized by Hoechst staining. (B) Quantitation of fluorescence label in YAC-1 cells treated with FITC-GraB (GraB) with or without perforin (Perf). Cells were incubated in 1 μg/ml of FITC-GraB for 10 or 30 min then fixed and visualized with a CCD camera. Intracellular fluorescence was quantitated using an IPLabs Spectrum H-SU2 image analysis program. At least 30 cells were measured for each condition and the difference between extracellular and a maximum plateau of intracellular fluorescence calculated and scored. Data is expressed as the mean and SEM. The experiment was repeated several times with YAC-1 or HeLa cells with the same result. (C) Fluorescence of two YAC-1 cells treated for 30 min with FITC-GraB and analyzed using an IPLabs Spectrum image analysis program. Intracellular fluorescence was calculated for each cell by the difference between the background surrounding the cell and the mean peak of intracellular fluorescence on the y-Axis. (D) Image analysis of two cells treated with FITC-GraB and perforin for 30 min. (E) Image analysis of the autofluorescence of two YAC-1 cells used as background.
Figure 2
Figure 2
(A) Intracellular fluorescence of cells treated with FITCGraB in the presence and absence of perforin. HeLa cells are shown 30 min after incubation with FITC-GraB (1 μg/ml). The fluorescence is distributed diffusely throughout the cytoplasm and a shadow indicating lower levels is seen over the nucleus. After treatment with FITC-GraB and perforin for 30 min both HeLa cells (B) or YAC-1 cells (C) showed a dramatic redistribution with the FITC-GraB now seen in the nucleus with some cytoplasmic staining. In HeLa cells (B) the fluorescence was distributed around the nuclear membrane and in localized areas in the nucleus while in YAC-1 cells (C) the fluorescence was detected in areas of condensed chromatin or in apoptotic bodies. YAC-1 cells were treated with GraB and perforin in the presence of rhodamine-conjugated transferrin (D). Transferrin was not detected in the nucleus in cells undergoing apoptosis (arrow). Cells from GraB and perforin treatment in the presence of rhodamine-conjugated transferrin shown in D were stained with Hoechst dye to demonstrate the condensed chromatin in the apoptotic nucleus (E). The experiments described above were repeated at least three times with each target cell.
Figure 2
Figure 2
(A) Intracellular fluorescence of cells treated with FITCGraB in the presence and absence of perforin. HeLa cells are shown 30 min after incubation with FITC-GraB (1 μg/ml). The fluorescence is distributed diffusely throughout the cytoplasm and a shadow indicating lower levels is seen over the nucleus. After treatment with FITC-GraB and perforin for 30 min both HeLa cells (B) or YAC-1 cells (C) showed a dramatic redistribution with the FITC-GraB now seen in the nucleus with some cytoplasmic staining. In HeLa cells (B) the fluorescence was distributed around the nuclear membrane and in localized areas in the nucleus while in YAC-1 cells (C) the fluorescence was detected in areas of condensed chromatin or in apoptotic bodies. YAC-1 cells were treated with GraB and perforin in the presence of rhodamine-conjugated transferrin (D). Transferrin was not detected in the nucleus in cells undergoing apoptosis (arrow). Cells from GraB and perforin treatment in the presence of rhodamine-conjugated transferrin shown in D were stained with Hoechst dye to demonstrate the condensed chromatin in the apoptotic nucleus (E). The experiments described above were repeated at least three times with each target cell.
Figure 3
Figure 3
Cell associated GraB induces apoptosis with the addition of perforin. (A) 125IUdR-labelled YAC-1 cells were preincubated in GraB (2 μg/ml) for 15 min, then washed and perforin added at increasing concentrations and the percent apoptotic cells calculated after incubation for 3 h. (B) GraB (2 μg/ml) was incubated with YAC-1 cells for 15 min, washed, and then incubated for increasing periods of time as shown. Cells were then washed again and perforin added for an additional 3 h. (Filled circles) 60 ng/ml, (filled squares) 30 ng/ml, (filled triangles) 15 ng/ml.
Figure 4
Figure 4
GraB crosses the plasma membrane by an energy-dependent mechanism. (A) HeLa cells were treated with NaF (1 mM) an inhibitor of glycolysis and DNP (100 μM) which uncouples oxidative phosphorylation at 4°C or cytochalasin B (Cytoch B) (2 μg/ml) and then incubated with FITC-GraB (GraB) or GraB and perforin (Perf) for 30 min then analyzed as described in Fig. 2. (B) Cells treated with DNP/NaF at 4°C then FITC GraB showed fluorescence localized to the plasma membrane in discreet patches or clumps.
Figure 4
Figure 4
GraB crosses the plasma membrane by an energy-dependent mechanism. (A) HeLa cells were treated with NaF (1 mM) an inhibitor of glycolysis and DNP (100 μM) which uncouples oxidative phosphorylation at 4°C or cytochalasin B (Cytoch B) (2 μg/ml) and then incubated with FITC-GraB (GraB) or GraB and perforin (Perf) for 30 min then analyzed as described in Fig. 2. (B) Cells treated with DNP/NaF at 4°C then FITC GraB showed fluorescence localized to the plasma membrane in discreet patches or clumps.
Figure 5
Figure 5
Detection of intracellular GraB by immunogold staining. YAC-1 cells incubated in GraB (2 μg/ml) for 10 min were washed and fixed, then thin cryosections incubated with murine anti-GraB antibody or colloidal gold goat anti–mouse IgG. (A) Colloidal gold anti-GraB (arrows) localized to an area of increased electron density on the external leaf of the plasma membrane. (B) High power magnification of gold particles (arrows) in the cytoplasm near the nuclear membrane. (C) A lower magnification of B showing the position of the immunogold in the whole cell (arrows). (D) YAC-1 cell treated with anti-GraB antibody and immunogold in the absence of GraB had no detectable gold particles.
Figure 5
Figure 5
Detection of intracellular GraB by immunogold staining. YAC-1 cells incubated in GraB (2 μg/ml) for 10 min were washed and fixed, then thin cryosections incubated with murine anti-GraB antibody or colloidal gold goat anti–mouse IgG. (A) Colloidal gold anti-GraB (arrows) localized to an area of increased electron density on the external leaf of the plasma membrane. (B) High power magnification of gold particles (arrows) in the cytoplasm near the nuclear membrane. (C) A lower magnification of B showing the position of the immunogold in the whole cell (arrows). (D) YAC-1 cell treated with anti-GraB antibody and immunogold in the absence of GraB had no detectable gold particles.
Figure 6
Figure 6
Microinjection of GraB into the cytoplasm of B16 melanoma. After GraB (2 μg/ml) (A) or medium (B) injection into B16 cells (injected cells indicated by arrows), the B16 cells were examined by DIC microscopy using image analysis. After 6 min the cell nucleoli became prominent and by 12 min plasma membrane blebbing was noted (arrowheads). No further changes were observed over the next 60 min. Plasma membrane and nuclear changes were transient. (C) Hoechst dye staining of GraB microinjected B16 melanoma cells. A group of cells were injected with GraB (1 μg/ml) and after 45 min stained with Hoechst dye. Similar to the DIC microscopy (Fig. 3) the only nuclear changes observed was the increasing prominence of the nucleoli (arrows). Microinjection experiments were repeated at different doses and times in at least five separate experiments. (D) Cells incubated in GraB (1 μg/ml) and perforin (60 ng/ml) for 45 min display the typical chromatin condensation pattern of apoptotic cells (arrows). (E) Control cells incubated in medium.
Figure 6
Figure 6
Microinjection of GraB into the cytoplasm of B16 melanoma. After GraB (2 μg/ml) (A) or medium (B) injection into B16 cells (injected cells indicated by arrows), the B16 cells were examined by DIC microscopy using image analysis. After 6 min the cell nucleoli became prominent and by 12 min plasma membrane blebbing was noted (arrowheads). No further changes were observed over the next 60 min. Plasma membrane and nuclear changes were transient. (C) Hoechst dye staining of GraB microinjected B16 melanoma cells. A group of cells were injected with GraB (1 μg/ml) and after 45 min stained with Hoechst dye. Similar to the DIC microscopy (Fig. 3) the only nuclear changes observed was the increasing prominence of the nucleoli (arrows). Microinjection experiments were repeated at different doses and times in at least five separate experiments. (D) Cells incubated in GraB (1 μg/ml) and perforin (60 ng/ml) for 45 min display the typical chromatin condensation pattern of apoptotic cells (arrows). (E) Control cells incubated in medium.
Figure 7
Figure 7
GraB is inactive against YAC-1 target cells with detergent permeabilized plasma membrane. (A) GraB was titered against a constant dose of perforin (40 ng/ml). (Filled triangles) Increasing amounts of Triton X-100 were added to cells with either a constant dose of GraB (1 μg/ml) (filled circles) or medium control (filled squares). (B) GraB titered with perforin as in Fig. 1 A (filled triangles). GraB (1 μg/ml) was incubated with increasing amounts of digitonin (filled circles) and compared to incubation with digitonin only (filled squares).

References

    1. Kaegi D, Vignaux F, Ledermann B, Buerki K, Depraetere V, Nagata S, Hengartner H, Golstein P. Fas and perforin pathways as major mechanisms of T cell-mediated cytotoxicity. Science (Wash DC) 1994;265:528–530. - PubMed
    1. Lowin B, Hahne M, Mattmann C, Tschopp J. Cytolytic T-cell cytotoxicity is mediated through perforin and Fas lytic pathways. Nature (Lond) 1994;370:650–652. - PubMed
    1. Kaegi D, Ledermann B, Buerki K, Seiler P, Odermatt B, Olsen KJ, Podack ER, Zinkernagel RM, Hengartner H. Cytotoxicity mediated by T cells and natural killer cells is greatly impaired in perforin-deficient mice. Nature (Lond) 1994;369:31–37. - PubMed
    1. Walsh CM, Matloubian M, Liu CC, Ueda R, Kurahara CG, Christensen JL, Huang MTF, Young JDE, Ahmed R, Clark WR. Immune function in mice lacking the perforin gene. Proc Natl Acad Sci USA. 1994;91:10854–10858. - PMC - PubMed
    1. Kojima H, Shinohara N, Hanaoka S, Someya Shirota Y, Takagaki Y, Ohno H, Saito T, Katayama T, Yagita H, Okumura K, et al. Two distinct pathways of specific killing revealed by perforin mutant cytotoxic T lymphocytes. Immunity. 1994;1:357–364. - PubMed

Publication types

MeSH terms