. 1997 Mar 3;185(5):953-61.
doi: 10.1084/jem.185.5.953.

NF-kappa B RelA-deficient lymphocytes: normal development of T cells and B cells, impaired production of IgA and IgG1 and reduced proliferative responses

Affiliations

NF-kappa B RelA-deficient lymphocytes: normal development of T cells and B cells, impaired production of IgA and IgG1 and reduced proliferative responses

T S Doi et al. J Exp Med. .

Abstract

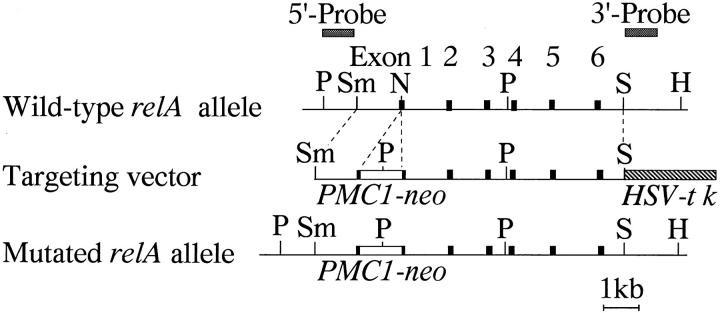
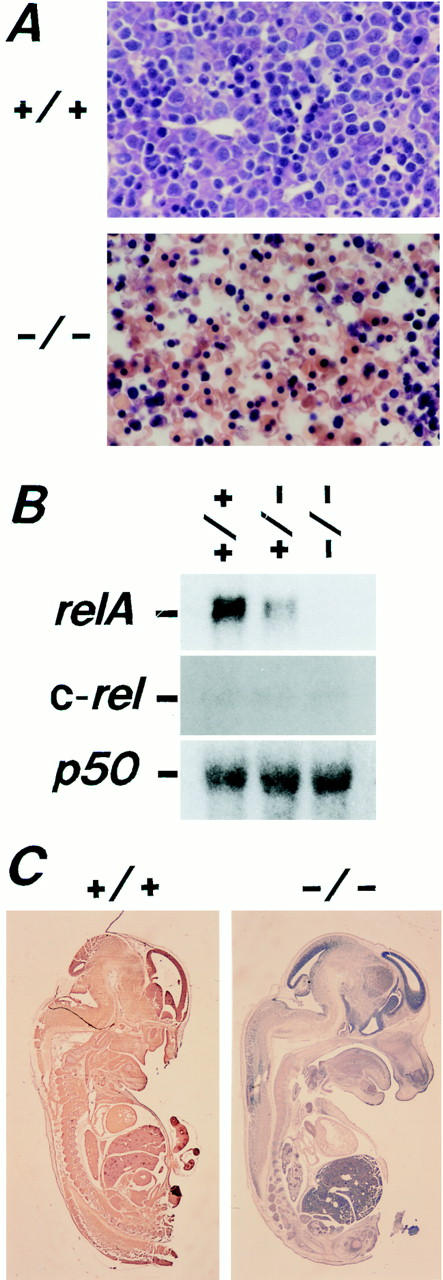
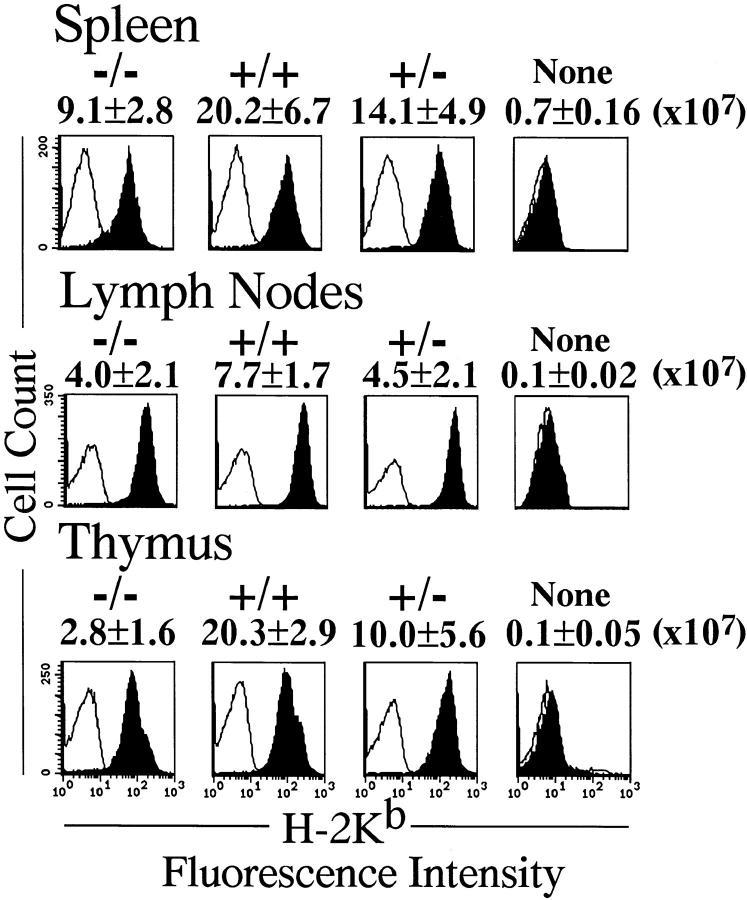
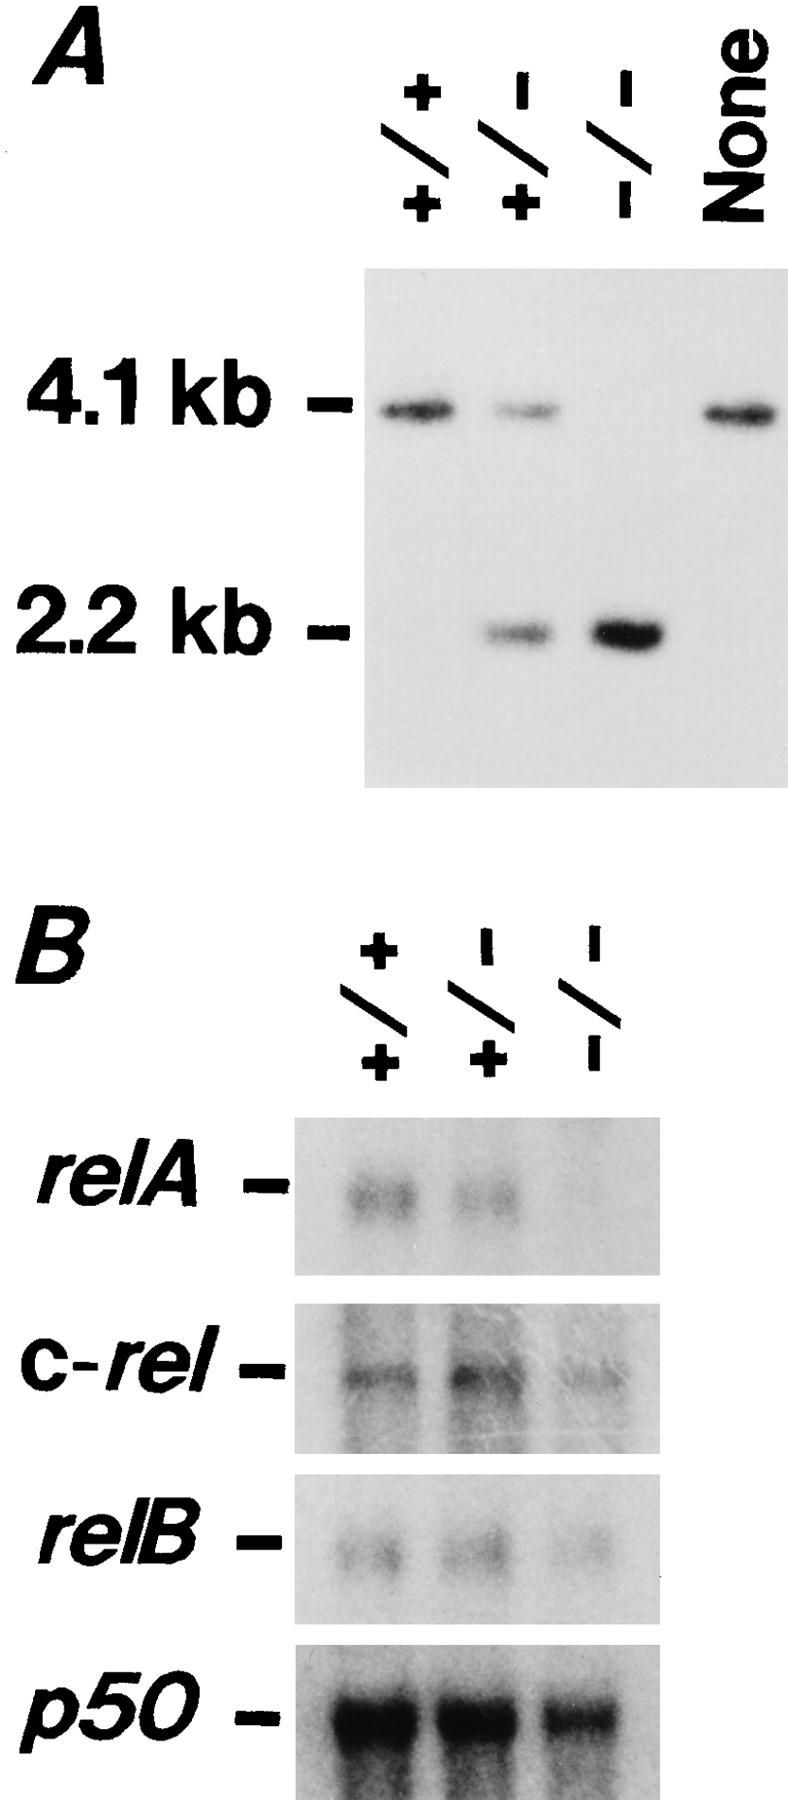
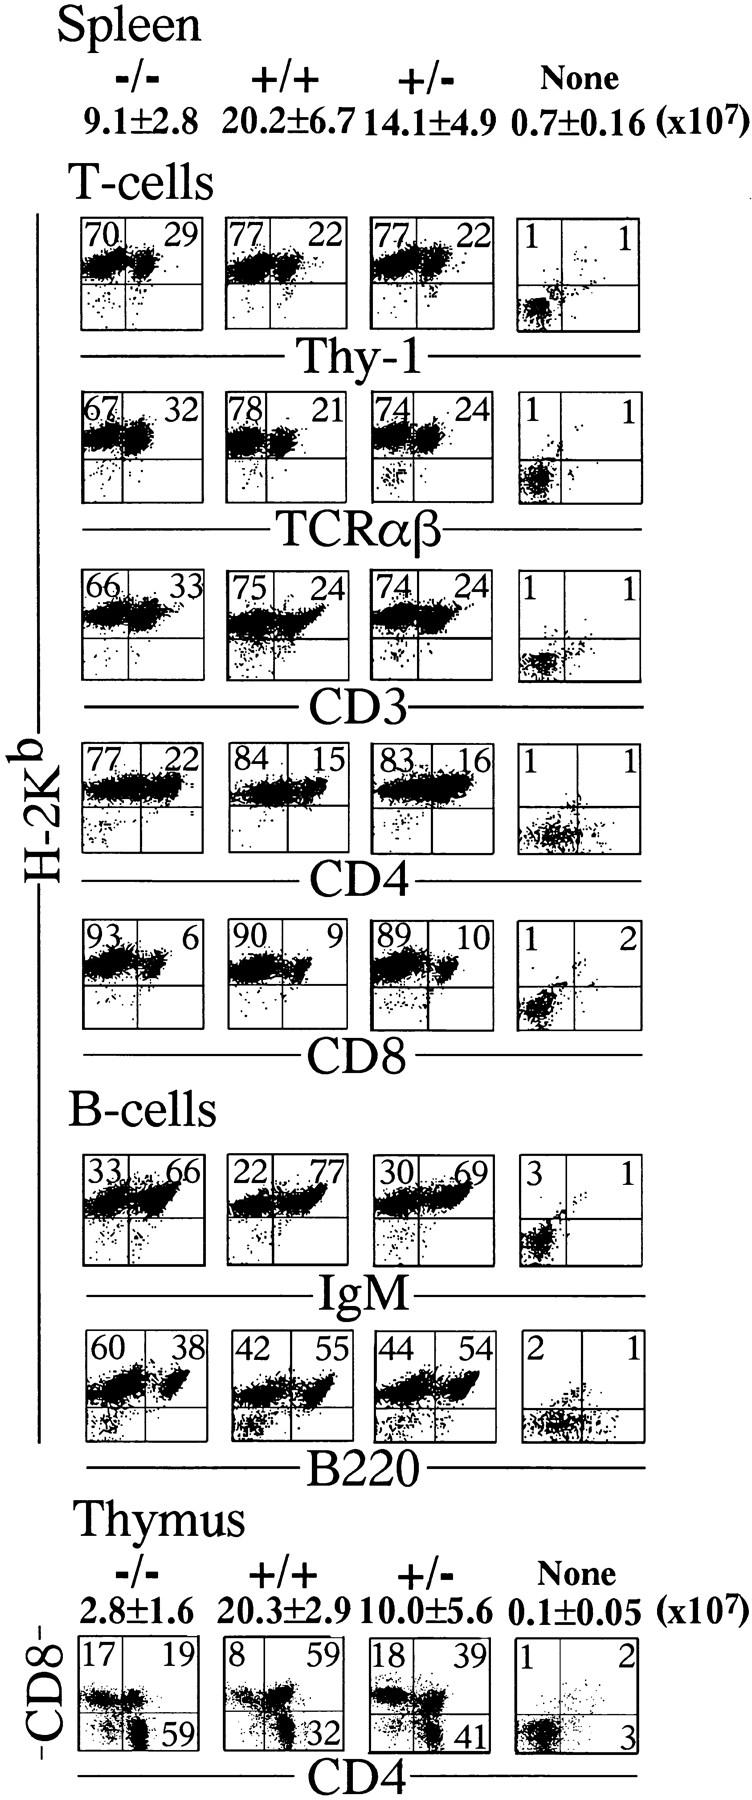
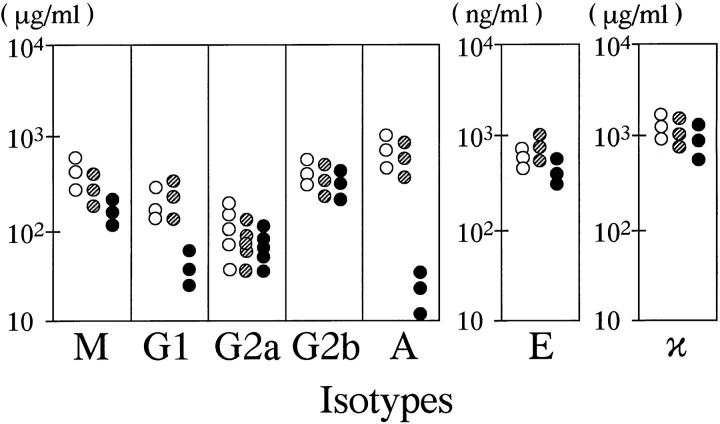
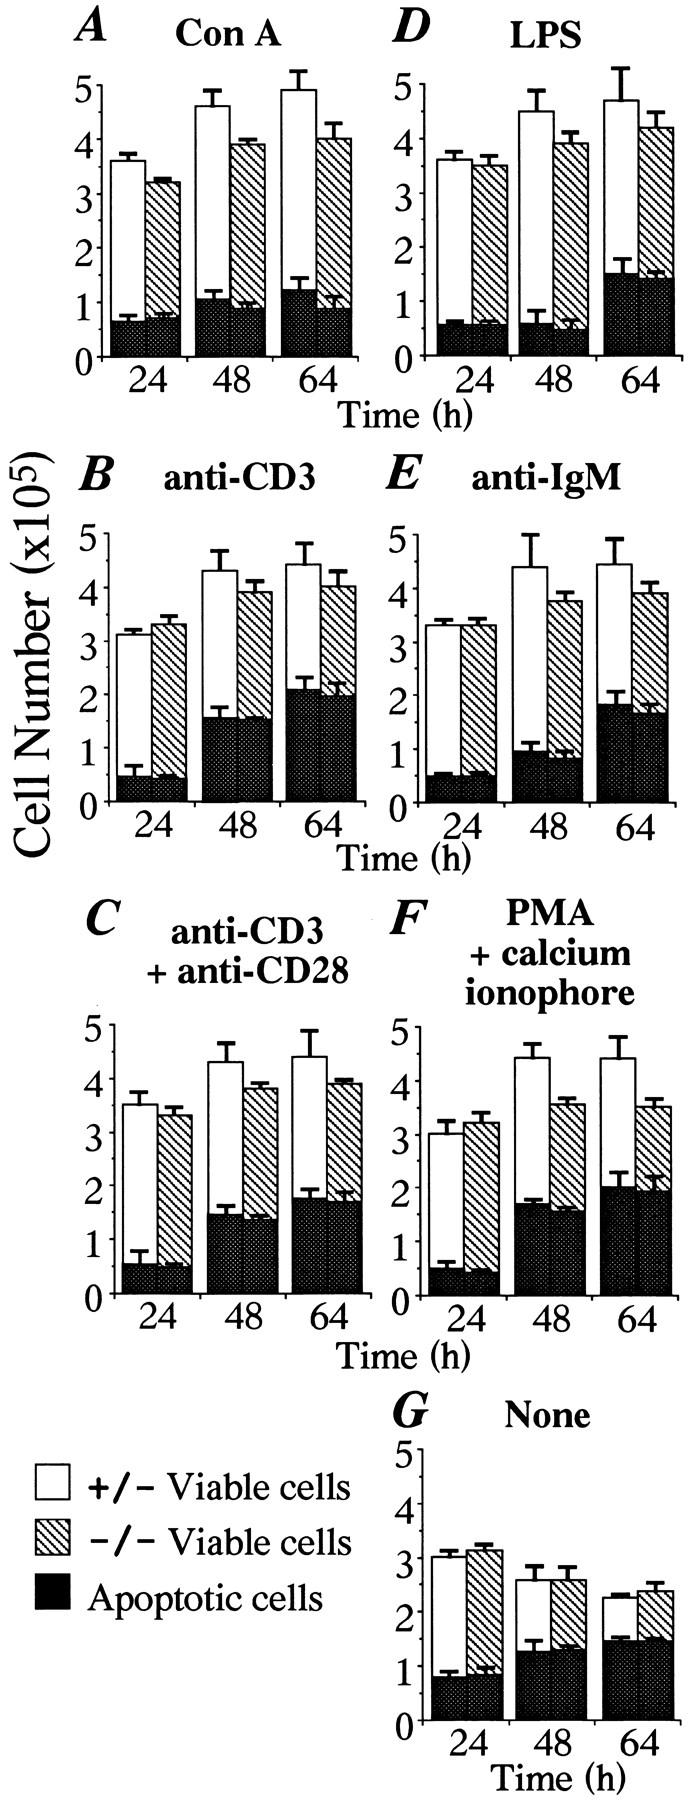
To investigate the function of NF-kappa B RelA (p65), we generated mice deficient in this NF-kappa B family member by homologous recombination. Mice lacking RelA showed liver degeneration and died around embryonic day 14.5. To elucidate the role of RelA in lymphocyte development and function, we transplanted fetal liver cells of 13.5-day embryos from heterozygote matings into irradiated SCID mice. Within 4 weeks, both T and B cells had developed in the SCID mice receiving relA-/- fetal liver transplants, similar to the relA+/+ and +/- cases. T cells were found to mature to Thy-1+/TCR alpha beta +/CD3+/CD4+ or CD8+, while B cells had the ability to differentiate to IgM+/B220+ and to secrete immunoglobulins. However, the secretion of IgG1 and IgA was reduced in RelA-deficient B cells. Furthermore, both T and B cells lacking RelA showed marked reduction in proliferative responses to stimulation with Con A, anti-CD3, anti-CD3 + anti-CD28, LPS, anti-IgM, and PMA + calcium ionophore. The results indicate that RelA plays a critical role in production of specific Ig isotypes and also in signal transduction pathways for lymphocyte proliferation.


Figures

Figure 1
Figure 1
Structure of the relA targeting vector. The wild-type mouse relA allele is shown at the top. The targeting vector is in the middle and the predicted mutant allele is at the bottom. The area predicted to undergo homologous recombination is indicated by the dotted lines. Exons are indicated by closed boxes. The probes used for diagnostic DNA blot analysis are also indicated at the top. Restriction enzyme sites: H, HindIII; N, NcoI; P, PstI; Sm, SmaI; S, SphI.
Figure 2
Figure 2
Liver degeneration and the absence of relA transcripts and RelA protein in relA−/− embryos. (A) Histological features of livers of ED14.5 relA+/+ and relA−/− embryos. In the liver of a relA+/+ embryo, hepatocytes with large cell size and light nuclear staining are mixed with the hematopoietic cells with dark nuclear staining. In the liver of relA−/− embryos, hepatocytes are disintegrated, while the hematopoietic cells are apparently normal. Magnification is 240-fold. (B) RNA blot analysis of ED13.5 relA+/+, +/−, and −/− embryos. 10 μg of total RNA were loaded per lane and analyzed with the relA, c-rel, relB, and p50 cDNA probes. relA transcripts were present in the relA+/+ and +/− embryos, but not in the relA−/− embryos. The relA+/+, +/− and −/− embryos expressed similar amounts of c-rel and p50 transcripts. No relB transcripts were detected in ED13.5 embryos (data not shown). (C) RelA protein in ED13.5 relA+/+ and relA−/− embryos. With rabbit antiRelA antibody and the ABC method, RelA protein is ubiquitously detected in the relA+/+ embryo, but is completely absent in the relA−/− embryo. Magnification is eightfold.
Figure 3
Figure 3
The fetal liver origin of lymphocytes in transplanted SCID mice. By transplantation of the fetal liver from relA+/+, +/−, or −/− ED 13.5 embryos into irradiated SCID mice, the number of lymphocytes increased. Average numbers of the cells in the spleen, lymph nodes, and thymus in groups of three mice receiving transplants are indicated above the distribution plots. Staining in the presence and absence of mAb to H-2Kb is indicated by solid and open curves, respectively. Flow cytometric analysis of spleen cells, lymph node cells, and thymocytes showed the expression of H-2Kb, indicating the fetal liver origin.
Figure 4
Figure 4
DNA and RNA blot analyses of the spleen cells of the transplanted SCID mice. (A) DNA blot analysis. DNA digested by PstI was analyzed with a 5′ franking probe (see Fig. 1); the wild-type relA allele yielding a 4.1-kb fragment, and the mutant allele a 2.2-kb fragment. (B) RNA blot analysis. Note the lack of relA transcripts in the spleen cells of mice transplanted with relA−/− fetal liver cells. The relA−/−, +/+, and +/− spleen cells express similar amounts of c-rel, relB, and p50 transcripts.
Figure 5
Figure 5
Surface antigen profiles of spleen cells and thymocytes of SCID mice transplanted with ED13.5 fetal liver cells. Cells were examined by two-color staining using various combinations of antibodies. The expression of H-2Kb by spleen cells confirms their fetal liver origin. As for T cell markers, Thy-1, TCRαβ, CD3, CD4, and CD8 were examined and as for B cell makers, IgM and B220 were examined. Even relA−/− fetal liver cells develop normally to mature T and B cells in the transplanted SCID mice.
Figure 6
Figure 6
The serum Ig levels in SCID mice transplanted with fetal liver cells. 4 wk after the transplantation, mice with relA−/− fetal livers were able to secrete Ig in their sera, with the total amount being comparable to those with relA+/+ or relA+/− cells, but the IgA and IgG1 levels were found to be significantly lower. SCID mice secrete hardly detectable levels of any Ig isotypes. Open, striped, and closed circles correspond to mice transplanted with relA+/+, +/−, and −/− fetal liver cells, respectively.
Figure 7
Figure 7
Cells in apoptosis during the course of proliferation assays. Spleen cells from mice transplanted with relA+/− or −/− fetal liver cells were stimulated with various mitogens as in Table 2. The percentages of apoptotic cells were determined using the TUNEL technique with a FACScan® (32, 33). The numbers of viable cells were determined by the trypan blue exclusion test. At the beginning of stimulation, no cells were in apoptosis. The averages and SD values from three independent experiments are shown in the figure.

References

    1. Baldwin AS., Jr The NF-κB and IκB proteins: New discoveries and insights. Annu Rev Immunol. 1996;14:649–681. - PubMed
    1. Sen R, Baltimore D. Multiple nuclear factors interact with the immunoglobulin enhancer sequences. Cell. 1986;46:705–716. - PubMed
    1. Baeuerle PA, Henkel T. Function and activation of NF-κB in the immune system. Annu Rev Immunol. 1994;12:141–179. - PubMed
    1. Liou H-C, Sha WC, Scott ML, Baltimore D. Sequential induction of NF-κB/Rel family protein during B-cell terminal differentiation. Mol Cell Biol. 1994;14:5349–5359. - PMC - PubMed
    1. Verweij CL, Geerts M, Aarden LA. Activation of interleukin-2 gene transcription via T-cell surface molecule CD28 is mediated through an NF-κB-like response element. J Biol Chem. 1991;266:14179–14182. - PubMed

Publication types

MeSH terms