

Cell cycle-dependent phosphorylation of mammalian protein phosphatase 1 by cdc2 kinase
- PMID: 9122166
- PMCID: PMC20059
- DOI: 10.1073/pnas.94.6.2168
Cell cycle-dependent phosphorylation of mammalian protein phosphatase 1 by cdc2 kinase
Abstract
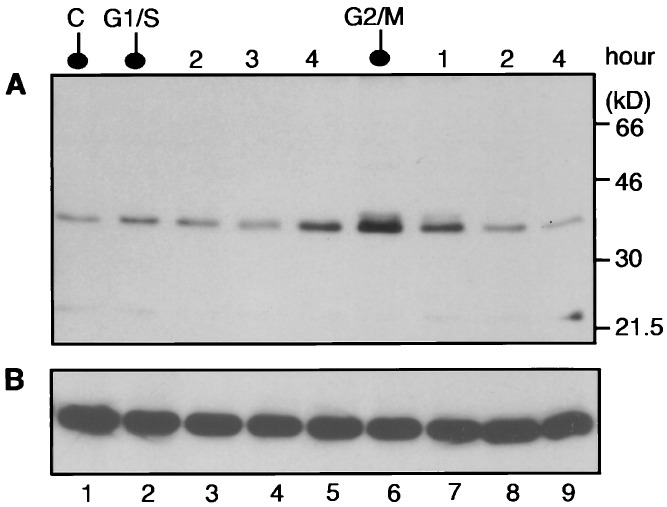
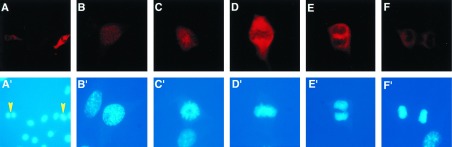
Protein phosphatase 1 (PP-1) is known to be a critical component of eukaryotic cell cycle progression. In vitro, our previous studies showed that cdc2 kinase phosphorylates Thr-320 (T320) in PP-1, and that this leads to inhibition of enzyme activity. To examine directly the phosphorylation of PP-1 in intact mammalian cells, an antibody has been prepared that specifically recognizes PP-1C alpha phosphorylated at T320. Cell synchronization studies revealed in a variety of cell types that T320 of PP-1 was phosphorylated to high levels only during early to mid-mitosis. The phosphorylation of T320 of PP-1 was reduced by the cyclin-dependent protein kinase inhibitor, olomoucine, and increased by the PP-1/PP-2A inhibitor, calyculin A. Immunofluorescence microscopy using phospho-T320 antibody indicated that in NIH 3T3 cells the phosphorylation of PP-1 began to increase from basal levels in prophase and to peak at metaphase. Immunostaining indicated that phospho-PP-1 was localized exclusively to nonchromosomal regions. Furthermore, in cell fractionation studies of mitotic cells, phospho-PP-1 was detectable only in the soluble fraction. These observations suggest that phosphorylation by cdc2 kinase in early to mid-mitosis and inhibition of PP-1 activity is likely to contribute to the increased state of phosphorylation of proteins that is critical to the initiation of normal cell division.
Figures


Similar articles
-
Phosphorylation of the Src substrate Sam68 by Cdc2 during mitosis.Oncogene. 1997 Sep;15(11):1247-53. doi: 10.1038/sj.onc.1201289. Oncogene. 1997. PMID: 9315091
-
Role of protein phosphatase-2A and -1 in the regulation of GSK-3, cdk5 and cdc2 and the phosphorylation of tau in rat forebrain.FEBS Lett. 2000 Nov 17;485(1):87-93. doi: 10.1016/s0014-5793(00)02203-1. FEBS Lett. 2000. PMID: 11086171
-
Mitotic control of RUNX2 phosphorylation by both CDK1/cyclin B kinase and PP1/PP2A phosphatase in osteoblastic cells.J Cell Biochem. 2007 Apr 15;100(6):1509-17. doi: 10.1002/jcb.21137. J Cell Biochem. 2007. PMID: 17171635
-
Function and regulation of cdc25 protein phosphate through mitosis and meiosis.Prog Cell Cycle Res. 1995;1:215-28. doi: 10.1007/978-1-4615-1809-9_17. Prog Cell Cycle Res. 1995. PMID: 9552365 Review.
-
Multiple cyclin-dependent kinase complexes and phosphatases control G2/M progression in alfalfa cells.Plant Mol Biol. 2000 Aug;43(5-6):595-605. doi: 10.1023/a:1006412413671. Plant Mol Biol. 2000. PMID: 11089863 Review.
Cited by
-
Targeted disruption of glycogen synthase kinase 3A (GSK3A) in mice affects sperm motility resulting in male infertility.Biol Reprod. 2015 Mar;92(3):65. doi: 10.1095/biolreprod.114.124495. Epub 2015 Jan 7. Biol Reprod. 2015. PMID: 25568307 Free PMC article.
-
Molecular profiling and combinatorial activity of CCT068127: a potent CDK2 and CDK9 inhibitor.Mol Oncol. 2018 Mar;12(3):287-304. doi: 10.1002/1878-0261.12148. Epub 2018 Jan 28. Mol Oncol. 2018. PMID: 29063678 Free PMC article.
-
Regulation of Ikaros function by casein kinase 2 and protein phosphatase 1.World J Biol Chem. 2011 Jun 26;2(6):126-31. doi: 10.4331/wjbc.v2.i6.126. World J Biol Chem. 2011. PMID: 21765978 Free PMC article.
-
A Peak of H3T3 Phosphorylation Occurs in Synchrony with Mitosis in Sea Urchin Early Embryos.Cells. 2020 Apr 7;9(4):898. doi: 10.3390/cells9040898. Cells. 2020. PMID: 32272587 Free PMC article.
-
Selective dephosphorylation by PP2A-B55 directs the meiosis I-meiosis II transition in oocytes.Elife. 2021 Aug 3;10:e70588. doi: 10.7554/eLife.70588. Elife. 2021. PMID: 34342579 Free PMC article.
References
-
- Reed S I. Annu Rev Cell Biol. 1992;8:529–561. - PubMed
-
- Coleman T R, Dunphy W G. Curr Opin Cell Biol. 1994;6:877–882. - PubMed
-
- King R W, Jackson P K, Kirschner M W. Cell. 1994;79:563–571. - PubMed
-
- Hunter T, Pines J. Cell. 1994;79:573–582. - PubMed
-
- Elledge S, Harper J W. Curr Opin Cell Biol. 1994;6:847–852. - PubMed
Publication types
MeSH terms
Substances
Grants and funding
LinkOut - more resources
Full Text Sources
Molecular Biology Databases
Miscellaneous
