. 1997 Mar 18;94(6):2507-12.
doi: 10.1073/pnas.94.6.2507.

Fig1, an interleukin 4-induced mouse B cell gene isolated by cDNA representational difference analysis

Affiliations

Fig1, an interleukin 4-induced mouse B cell gene isolated by cDNA representational difference analysis

C C Chu et al. Proc Natl Acad Sci U S A. .

Abstract

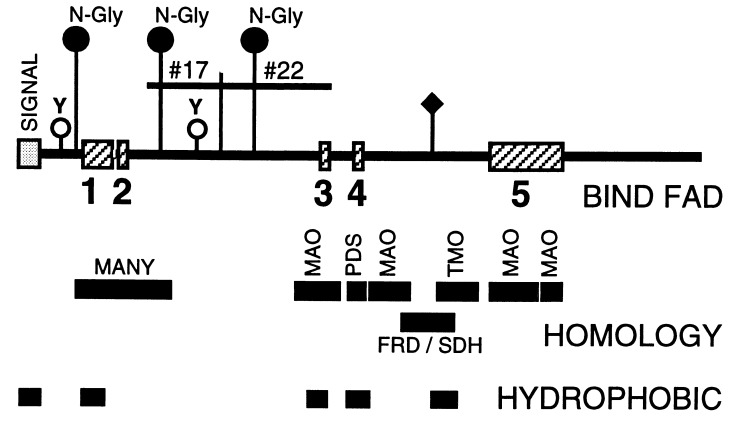
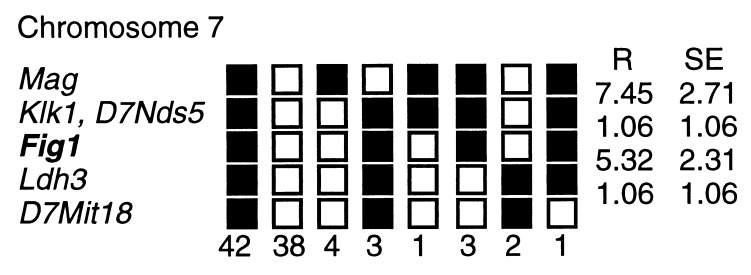
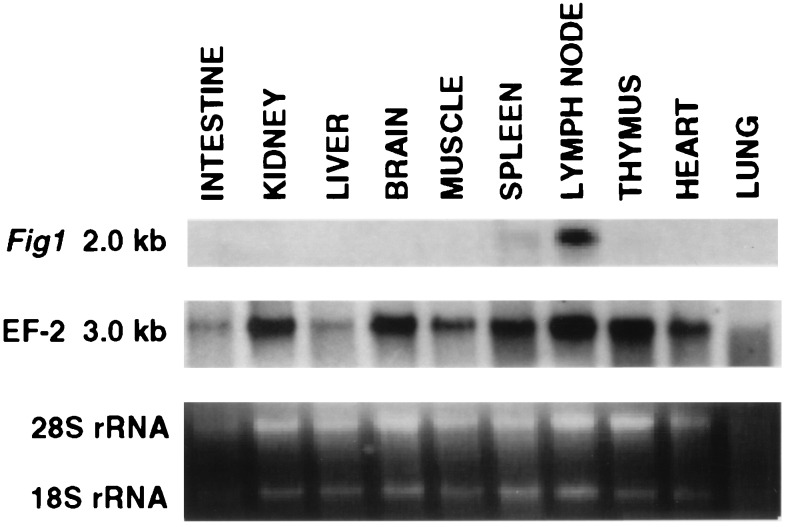
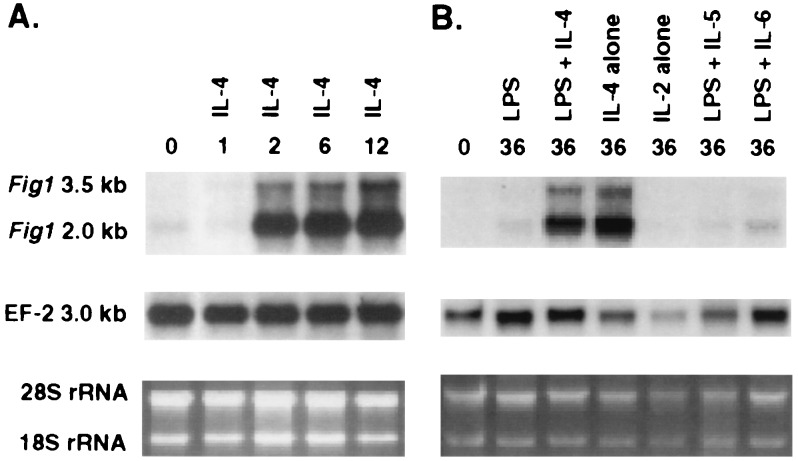
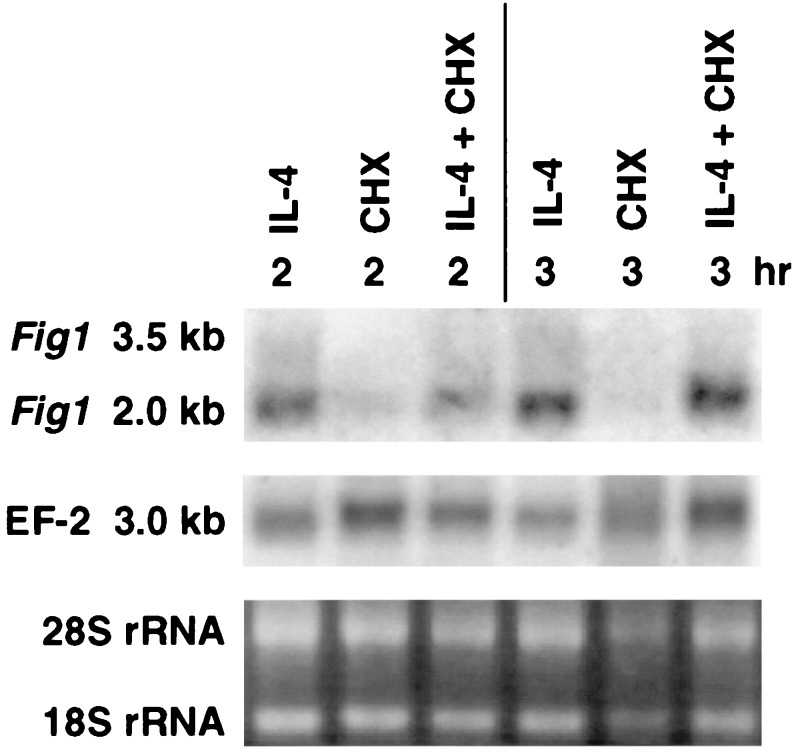
Interleukin 4 (IL-4) is a cytokine that regulates growth and differentiation of lymphoid and nonlymphoid cells. To study the molecular basis of IL-4 function, we used a cDNA subtraction approach based on the representational difference analysis method. This subtractive amplification technique allowed us to use small amounts of RNA from lipopolysaccharide +/- IL-4-stimulated normal B cells to obtain IL-4-induced genes from these cells. We report here on one such gene, Fig1 (interleukin-four induced gene 1), the first characterized immediate-early IL-4 inducible gene from B cells. Fig1 expression is strikingly limited to the lymphoid compartment. B cells, but not T cells or mast cells, express Fig1 in response to IL-4 within 2 hr in a cycloheximide resistant manner. IL-2, IL-5, and I1-6 do not induce Fig1 in culture. Fig1 maps between Klk1 and Ldh3 on mouse chromosome 7, near two loci involved with murine lupus, Sle3 and Lbw5. The Fig1 cDNA sequence encodes a predicted 70-kDa flavoprotein with best homology to the monoamine oxidases, particularly in domains responsible for FAD binding.


Figures

Figure 1
Figure 1
Schematic of both 2.0- and 3.5-kb Fig1 mRNA sequences. The sequences of two distinct Fig1 mRNAs were largely obtained from cDNA library clones and the remaining 5′ end sequences were obtained by RACE. Both mRNA forms are shown schematically with coding regions shown in large solid rectangles and 5′ and 3′ untranslated regions in large shaded rectangles; areas corresponding to introns and to the poly(A) tail are shown in thin rectangles. Exons and introns of Fig1ps are numbered. Locations of original subtraction library clones 20-8T#17 and 20-8T#22 are indicated. Clone 20-8T#17 contains exon 2 and part of intron 2 from Fig1ps. Clone 20-8T#22 contains exon 2 and part of exon 3 from Fig1. Δ, splice sites, with one indicating a splice site found in the 607-bp genomic sequence obtained for genetic mapping. ⋄, Sau3AI restriction enzyme sites. Lengths in bp are shown in parentheses. Fig1 (GenBank accession no. U70429U70429) and Fig1ps (GenBank accession no. U70430U70430) had slight sequence differences (7 bp) in the untranslated area close to the poly(A) tail.
Figure 2
Figure 2
Schematic of predicted Fig1 protein. The results of computer program-aided sequence analysis of Fig1 is summarized in schematic form. Possible N-linked glycosylation sites (N-Gly) and tyrosine phosphorylation sites (Y) are indicated. Locations of sequence inferred from original subtraction library clones 20-8T#17 and 20-8T#22 are indicated. Predicted hydrophobic regions and FAD cofactor-binding regions (numbered 1–5) are shown. In addition, regions homologous to many known FAD binding and NAD binding proteins (MANY) and to specific FAD binding proteins (MAO, PDS, TMO, and FRD/SDH) are shown. The predicted signal peptide domain is also indicated (SIGNAL). ♦, Location of the homologous FRD/SDH active site. The consensus sequence for the dinucleotide binding fold (FAD-binding region 1) is +-#-X-#-G-X-G-X-X-G-X-X-X-#-X-X-#-X-X-X-X-X-X-#-X-#-X-Δ. +, a hydrophilic, positively charged residue; #, a hydrophobic residue; X, any amino acid; G, glycine; Δ, an acidic residue.
Figure 3
Figure 3
Genetic mapping. Haplotype figure from The Jackson Laboratory BSS backcross showing part of chromosome 7 with loci linked to Fig1. Loci are listed in order, with the most proximal at the top. Solid boxes represent the C57BL6/JEi allele and open boxes the SPRET/Ei allele. The number of animals with each haplotype is given at the bottom of each column of boxes. The percent recombination (R) between adjacent loci, equivalent to centimorgans, is given to the right of the figure, with the standard error (SE) for each R.
Figure 4
Figure 4
Tissue expression of Fig1. Total RNA (10 μg) prepared from the indicated mouse tissues was electrophoresed, Northern blotted, and probed with Fig1 or EF-2 (internal mRNA “housekeeping” standard). Ethidium bromide stained 28S and 18S rRNA bands are shown for comparison.
Figure 5
Figure 5
Fig1 induced by IL-4 specifically. Total RNA (10 μg) prepared from resting BALB/c splenic B lymphocytes (0 hr) or from B lymphocytes stimulated with IL-4 alone (1000 units/ml) for 1, 2, 6, and 12 hr (A), or with IL-4 alone (1000 units/ml), IL-2 alone, LPS alone, or LPS plus IL-4, IL-5, or IL-6 for 36 hr (B) was electrophoresed, Northern blotted, and probed with Fig1 or EF-2. Ethidium bromide stained 28S and 18S rRNA bands are shown for comparison. Concentrations of other reactants have been described.
Figure 6
Figure 6
Fig1 induction by IL-4 in B cells is not inhibited by cycloheximide. Total RNA (8.2 μg) prepared from BALB/c splenic B lymphocytes after culture for 2 or 3 hr under the conditions indicated [IL-4 (1000 units/ml), cycloheximide (CHX)] was electrophoresed, Northern blotted, and probed with Fig1 or EF-2. Ethidium bromide stained 28S and 18S rRNA bands are shown for comparison.

References

    1. Paul W E. Blood. 1991;77:1859–1870. - PubMed
    1. Berton M T, Uhr J W, Vitetta E S. Proc Natl Acad Sci USA. 1989;86:2829–2833. - PMC - PubMed
    1. Lisitsyn N, Lisitsyn N, Wigler M. Science. 1993;259:946–951. - PubMed
    1. National Research Council (1985) Guide for the Care and Use of Laboratory Animals, NIH Publication 85-23 (U.S. Public Health Service, Bethesda).
    1. Chu C C, Max E E, Paul W E. J Exp Med. 1993;178:1381–1390. - PMC - PubMed

MeSH terms

Associated data