. 1997 Apr 21;185(8):1413-22.
doi: 10.1084/jem.185.8.1413.

Nonmitogenic anti-CD3 monoclonal antibodies deliver a partial T cell receptor signal and induce clonal anergy

Affiliations

Nonmitogenic anti-CD3 monoclonal antibodies deliver a partial T cell receptor signal and induce clonal anergy

J A Smith et al. J Exp Med. .

Abstract

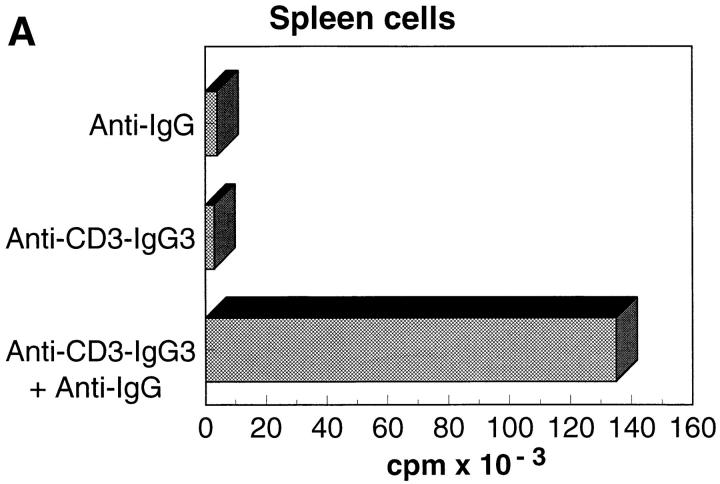
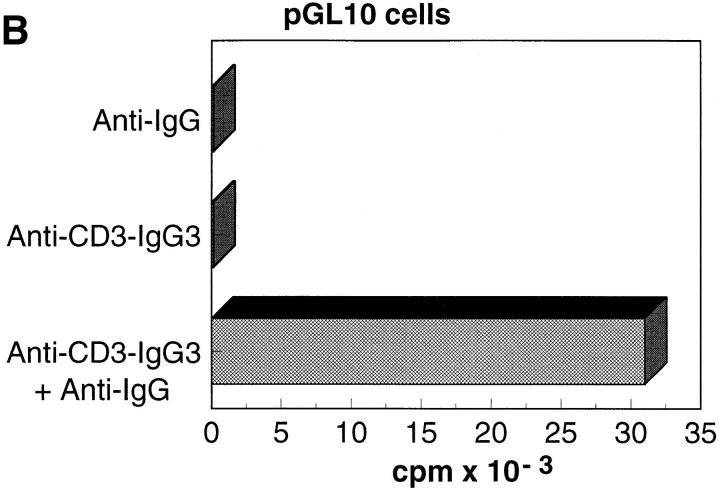
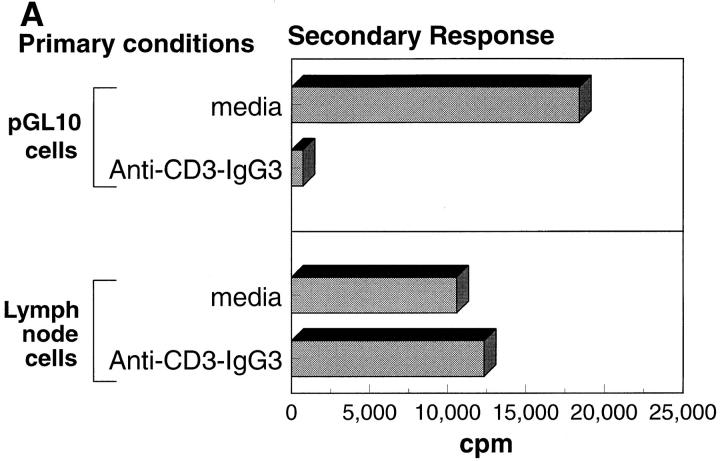
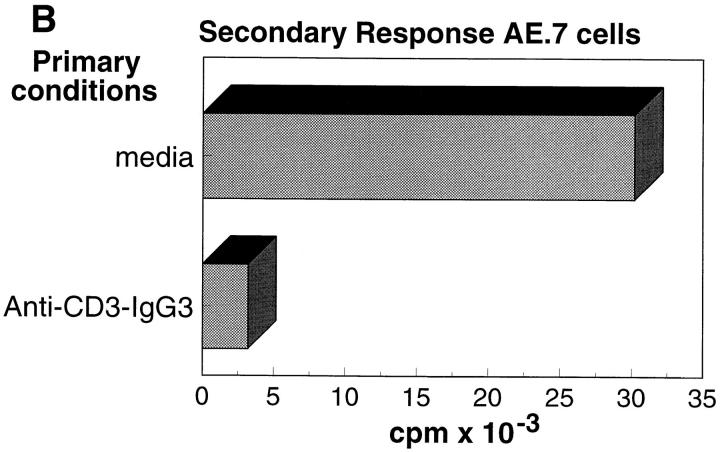
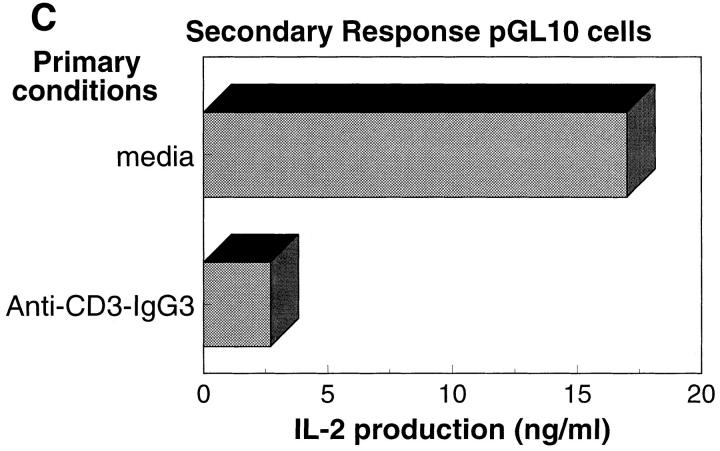
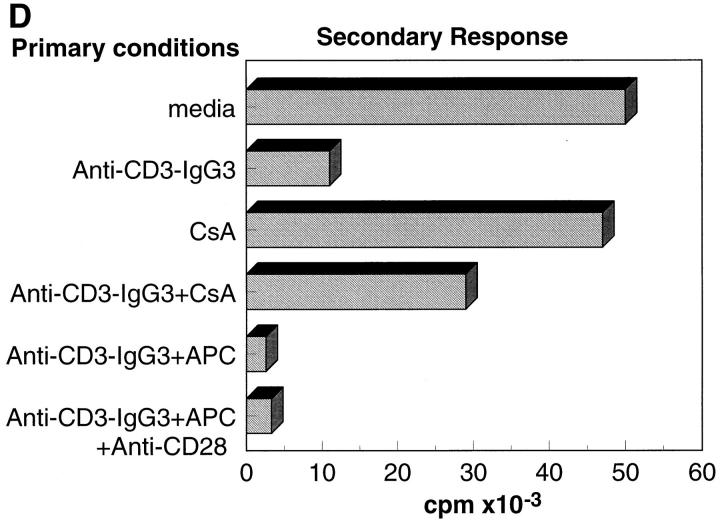
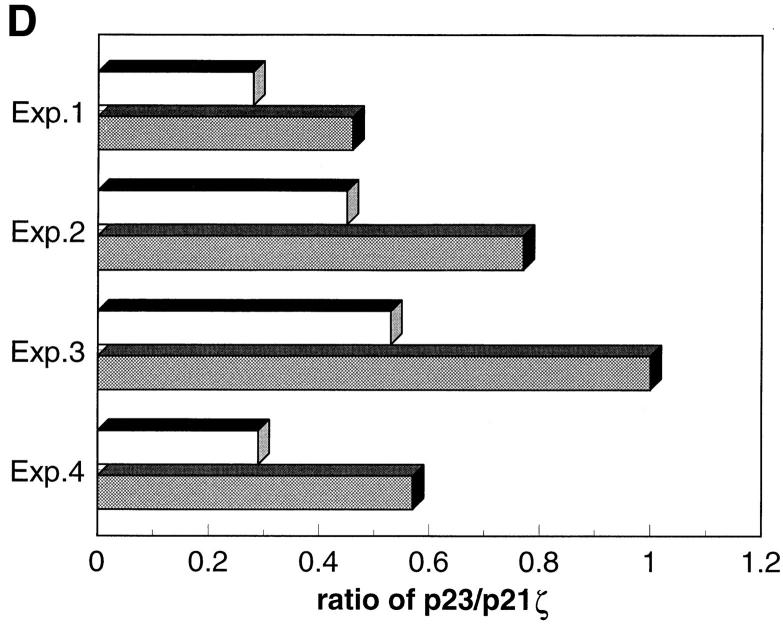
Anti-CD3 monoclonal antibodies (mAbs) are potent immunosuppressive agents used in clinical transplantation. However, the activation-related adverse side effects associated with these mAbs have prompted the development of less toxic nonmitogenic anti-CD3 mAb therapies. At present, the functional and biochemical consequences of T cell exposure to nonmitogenic anti-CD3 is unclear. In this study, we have examined the early signaling events triggered by a nonmitogenic anti-CD3 mAb. Like the mitogenic anti-CD3 mAb, nonnmitogenic anti-CD3 triggered changes in the T cell receptor (TCR) complex, including zeta chain tyrosine phosphorylation and ZAP-70 association. However, unlike the mitogenic anti-CD3 stimulation, nonmitogenic anti-CD3 was ineffective at inducing the highly phosphorylated form of zeta (p23) and tyrosine phosphorylation of the associated ZAP-70 tyrosine kinase. This proximal signaling deficiency correlated with minimal phospholipase Cgamma-1 phosphorylation and failure to mobilize detectable Ca2+. Not only did biochemical signals delivered by nonmitogenic anti-CD3 resemble altered peptide ligand signaling, but exposure of Th1 clones to nonmitogenic anti-CD3 also resulted in functional anergy. Finally, a bispecific anti-CD3 X anti-CD4 F(ab)'2 reconstituted early signal transduction events and induced proliferation, suggesting that defective association of lck with the TCR complex may underlie the observed signaling differences between the mitogenic and nonmitogenic anti-CD3.


Figures

Figure 1
Figure 1
Non-FcR–binding anti-CD3 induces proliferation only in the presence of crosslinking anti-Ig antibody. Whole spleen (top) or pGL10 clone cells (bottom) were cultured with an anti-CD3–IgG3 chimeric antibody and a secondary rabbit anti– mouse IgG3 Ab mAb for 48 h. Results are expressed as the mean of triplicate determinations and are representative of four independent experiments.
Figure 1
Figure 1
Non-FcR–binding anti-CD3 induces proliferation only in the presence of crosslinking anti-Ig antibody. Whole spleen (top) or pGL10 clone cells (bottom) were cultured with an anti-CD3–IgG3 chimeric antibody and a secondary rabbit anti– mouse IgG3 Ab mAb for 48 h. Results are expressed as the mean of triplicate determinations and are representative of four independent experiments.
Figure 2
Figure 2
T cell clones, but not lymph node T cells, are hyporesponsive after exposure to nonmitogenic anti-CD3. (A) DO 11.10 lymph node cells or pGL10 cells were incubated with either media alone or anti-CD3–IgG3 in the presence of irradiated T-depleted spleen cells for 24 h, washed, and rested for 72 h. The T cells were restimulated with mitogenic anti-CD3 (145-2C11) and fresh APC. (B) AE.7 clone cells were incubated with or without nonmitogenic anti-CD3, washed, and rested as above, and restimulated with the antigen PCC plus fresh APC. (C) pGL10 cells were incubated with or without nonmitogenic anti-CD3. After the 72-h rest, the pGL10 were restimulated with immobilized anti-CD3 plus anti-CD28. Culture supernatants were analyzed by IL-2 ELISA. (D) pGL10 cells were incubated with nonmitogenic anti-CD3 in the presence of cyclosporine A, splenic APC, and anti-CD28 as indicated. 72 h after the primary culture, cells were restimulated with OVA antigen and APC. A, C, and D are representative of two separate experiments, and B is representative of four experiments.
Figure 2
Figure 2
T cell clones, but not lymph node T cells, are hyporesponsive after exposure to nonmitogenic anti-CD3. (A) DO 11.10 lymph node cells or pGL10 cells were incubated with either media alone or anti-CD3–IgG3 in the presence of irradiated T-depleted spleen cells for 24 h, washed, and rested for 72 h. The T cells were restimulated with mitogenic anti-CD3 (145-2C11) and fresh APC. (B) AE.7 clone cells were incubated with or without nonmitogenic anti-CD3, washed, and rested as above, and restimulated with the antigen PCC plus fresh APC. (C) pGL10 cells were incubated with or without nonmitogenic anti-CD3. After the 72-h rest, the pGL10 were restimulated with immobilized anti-CD3 plus anti-CD28. Culture supernatants were analyzed by IL-2 ELISA. (D) pGL10 cells were incubated with nonmitogenic anti-CD3 in the presence of cyclosporine A, splenic APC, and anti-CD28 as indicated. 72 h after the primary culture, cells were restimulated with OVA antigen and APC. A, C, and D are representative of two separate experiments, and B is representative of four experiments.
Figure 3
Figure 3
Partial tyrosine phosphorylation of TCR components by nonmitogenic antiCD3. (A) 107 AE.7 cells or 2 × 10⁷ lymph node cells (C) were stimulated for 2.5 min with PBS (lane 1), goat anti–IgG3 antisera (lane 2), anti-CD3–IgG3 (lane 3), or anti-CD3–IgG3 plus goat anti–IgG3 (lane 4). Anti-ζ precipitations were resolved by electropheresis on a 12% gel and analyzed by Western blotting with anti-phosphotyrosine. (B) pGL10 cells were stimulated for 5 min with PBS, anti-CD3–IgG3, or anti-CD3–IgG3 plus rabbit anti–IgG3 antisera. Lysates were resolved and analyzed as in A. (D) Densitometry was performed on results from four independent experiments to quantitate the relative amounts of p21- and p23-phosphorylated ζ. In each experiment, the p23/p21 ratios for cross-linked anti-CD3 (hatched bars) and noncross-linked anti-CD3 (open bars) are represented.
Figure 3
Figure 3
Partial tyrosine phosphorylation of TCR components by nonmitogenic antiCD3. (A) 107 AE.7 cells or 2 × 10⁷ lymph node cells (C) were stimulated for 2.5 min with PBS (lane 1), goat anti–IgG3 antisera (lane 2), anti-CD3–IgG3 (lane 3), or anti-CD3–IgG3 plus goat anti–IgG3 (lane 4). Anti-ζ precipitations were resolved by electropheresis on a 12% gel and analyzed by Western blotting with anti-phosphotyrosine. (B) pGL10 cells were stimulated for 5 min with PBS, anti-CD3–IgG3, or anti-CD3–IgG3 plus rabbit anti–IgG3 antisera. Lysates were resolved and analyzed as in A. (D) Densitometry was performed on results from four independent experiments to quantitate the relative amounts of p21- and p23-phosphorylated ζ. In each experiment, the p23/p21 ratios for cross-linked anti-CD3 (hatched bars) and noncross-linked anti-CD3 (open bars) are represented.
Figure 4
Figure 4
Stimulation with noncross-linked anti-CD3 is sufficient for TCR association, but not phosphorylation of ZAP-70. 2 × 10⁷ pGL10 T cells were stimulated with PBS, goat anti–IgG3 alone, antiCD3–IgG3, or anti-CD3–IgG3 plus anti-IgG, for 2.5 min at 37°C, lysed, and immunoprecipitated with anti-ζ. Blots were probed with anti-ZAP70 (bottom), and then stripped and reprobed with anti-phosphotyrosine (top).
Figure 5
Figure 5
Impaired PLCγ-1 activation and Ca2+ flux in the absence of anti-CD3 cross-linking. (A) 2 × 10⁷ pGL10 cells were stimulated for 5 min at 37°C as indicated. Samples were precipitated with anti-PLCγ-1, and then resolved on an 8% gel. The Western blot was probed with antiphosphotyrosine (top), stripped, and then reprobed with anti-PLCγ-1 (bottom). (B) 4 × 10⁷ lymph node cells were stimulated for 5 min with PBS, anti-CD3–IgG3, or anti-CD3–IgG3 plus goat anti–IgG3 and analyzed as in A. Densitometry performed on this experiment showed a fourfold increase in PLCγ-1 phosphorylation (with compensation for protein amount) upon anti-CD3 cross-linking. (C) T cell clones were loaded with the calcium-sensitive dye indo-1, stimulated with anti-CD3–IgG3 (left), or antiCD3–IgG3 followed by rabbit anti–IgG3 (right). Cells were analyzed on a FACStar Plus® for calcium flux. The rise in relative intracellular calcium concentration is indicated by an increase in the 405/495 nm emission ratio. (A–C) Data is representative of two separate experiments.
Figure 5
Figure 5
Impaired PLCγ-1 activation and Ca2+ flux in the absence of anti-CD3 cross-linking. (A) 2 × 10⁷ pGL10 cells were stimulated for 5 min at 37°C as indicated. Samples were precipitated with anti-PLCγ-1, and then resolved on an 8% gel. The Western blot was probed with antiphosphotyrosine (top), stripped, and then reprobed with anti-PLCγ-1 (bottom). (B) 4 × 10⁷ lymph node cells were stimulated for 5 min with PBS, anti-CD3–IgG3, or anti-CD3–IgG3 plus goat anti–IgG3 and analyzed as in A. Densitometry performed on this experiment showed a fourfold increase in PLCγ-1 phosphorylation (with compensation for protein amount) upon anti-CD3 cross-linking. (C) T cell clones were loaded with the calcium-sensitive dye indo-1, stimulated with anti-CD3–IgG3 (left), or antiCD3–IgG3 followed by rabbit anti–IgG3 (right). Cells were analyzed on a FACStar Plus® for calcium flux. The rise in relative intracellular calcium concentration is indicated by an increase in the 405/495 nm emission ratio. (A–C) Data is representative of two separate experiments.
Figure 6
Figure 6
In the presence of a secondary cross-linker, anti-CD3 induces formation of an aggregated TCR cap. pGL10 T cells (left two columns) or purified DO 11.10 T cells (right two columns) were stimulated with anti-CD3– FITC at 37°C in the absence (left for each T cell type) or presence (right for each cell type) of goat anti–hamster cross-linking antisera. Cells were fixed at 0 min (top row) and 5 min (bottom row) after addition of cross-linker, and analyzed by confocal microscopy.
Figure 7
Figure 7
Stimulation with anti-CD3 × anti-CD4 heterodimer results in increased phosphorylation of proteins associated with the TCR complex and reconstitutes a mitogenic stimulus. (A) 107 pGL10 T cells were stimulated with the anti-CD3–Fos F(ab)′2, or the bispecific F(ab)′2 (antiCD3 × anti-CD4) for 5 min at 37°C. Samples were precipitated with anti-ζ, and blots were probed with anti-phosphotyrosine as in Fig. 2 A. (B) Whole spleen (top) or pGL10 T cells (bottom) were cultured with serial log dilutions of anti-CD3–Fos homodimer (open diamonds) or bispecific anti-CD3 × anti-CD4 (closed diamonds) for 48 h. Data is representative of two (A) and three (B) separate experiments.
Figure 7
Figure 7
Stimulation with anti-CD3 × anti-CD4 heterodimer results in increased phosphorylation of proteins associated with the TCR complex and reconstitutes a mitogenic stimulus. (A) 107 pGL10 T cells were stimulated with the anti-CD3–Fos F(ab)′2, or the bispecific F(ab)′2 (antiCD3 × anti-CD4) for 5 min at 37°C. Samples were precipitated with anti-ζ, and blots were probed with anti-phosphotyrosine as in Fig. 2 A. (B) Whole spleen (top) or pGL10 T cells (bottom) were cultured with serial log dilutions of anti-CD3–Fos homodimer (open diamonds) or bispecific anti-CD3 × anti-CD4 (closed diamonds) for 48 h. Data is representative of two (A) and three (B) separate experiments.

References

    1. Ortho Multicenter Transplant Study Group. A randomized clinical trial of OKT3 monoclonal antibody for acute rejection of cadaveric renal transplants. N Engl J Med. 1985;313:337–341. - PubMed
    1. Charpentier B, Hiesse C, Lantz O, Ferran C, Stephens S, O'Shaugnessy D, Bodmer M, Benoit G, Bach JF, Chatenoud L. Evidence that antihuman tumor necrosis factor monoclonal antibody prevents OKT3-induced acute syndrome. Transplantation. 1992;54:997–1002. - PubMed
    1. Ferran C, Sheehan K, Dy M, Schreiber R, Merite S, Landais P, Noel L, Grau G, Bluestone JA, Bach JF, Chatenoud L. Cytokine related syndrome following injection of anti-CD3 monoclonal antibody: further evidence for transient in vivo T cell activation. Eur J Immunol. 1990;20:509–515. - PubMed
    1. Kan EAR, Wright SD, Welte K, Wang CY. Fc receptors on monocytes cause OKT3-treated lymphocytes to internalize T3 and to secrete IL-2. Cell Immunol. 1986;98:181–187. - PubMed
    1. Alegre ML, Tso JY, Sattar HA, Smith J, Desalle F, Cole M, Bluestone JA. An anti-murine CD3 monoclonal antibody with a low affinity for Fc gamma receptors suppresses transplantation responses while minimizing acute toxicity and immunogenicity. J Immunol. 1995;155:1544–1555. - PubMed

Publication types