. 1997 May 15;17(10):3425-35.
doi: 10.1523/JNEUROSCI.17-10-03425.1997.

Control of neurotransmitter release by presynaptic waveform at the granule cell to Purkinje cell synapse

Affiliations

Control of neurotransmitter release by presynaptic waveform at the granule cell to Purkinje cell synapse

B L Sabatini et al. J Neurosci. .

Abstract

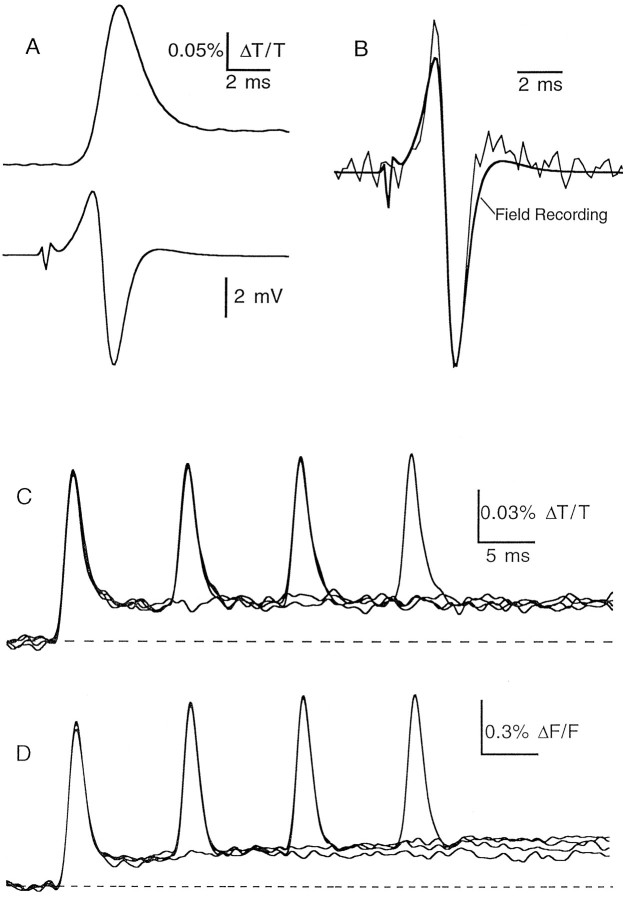
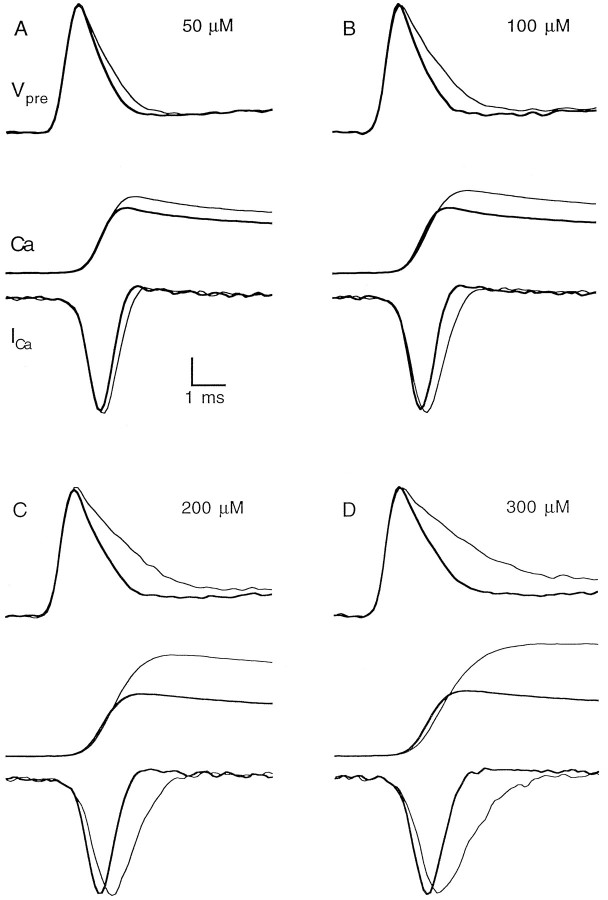
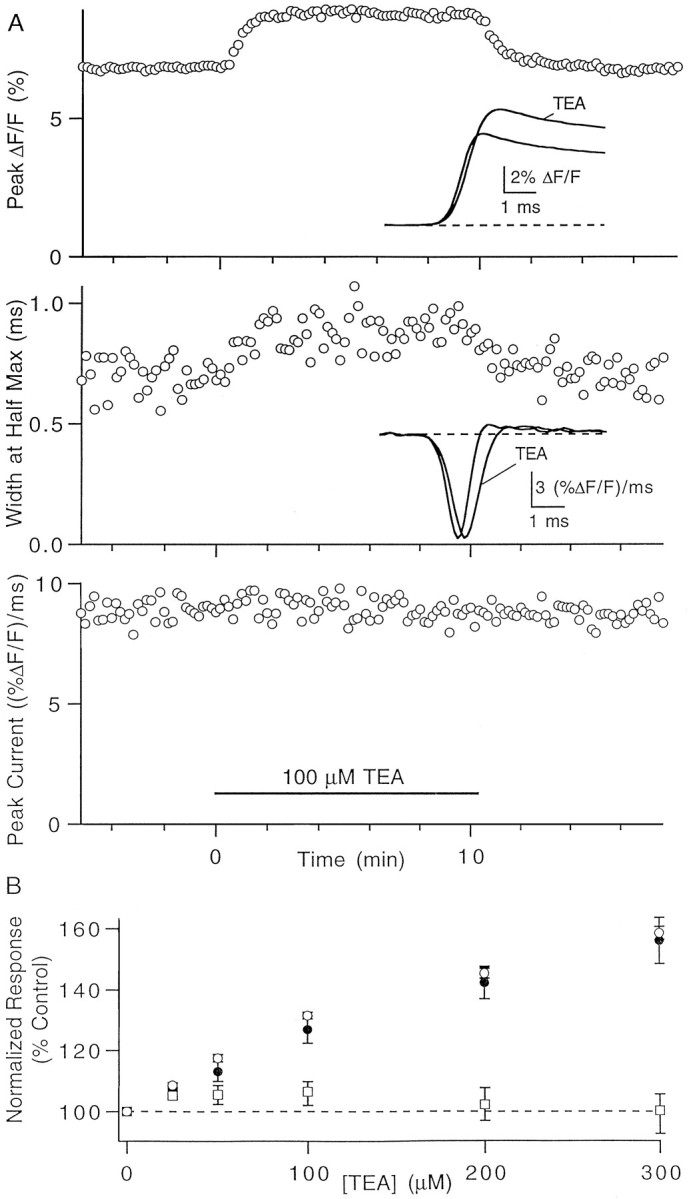
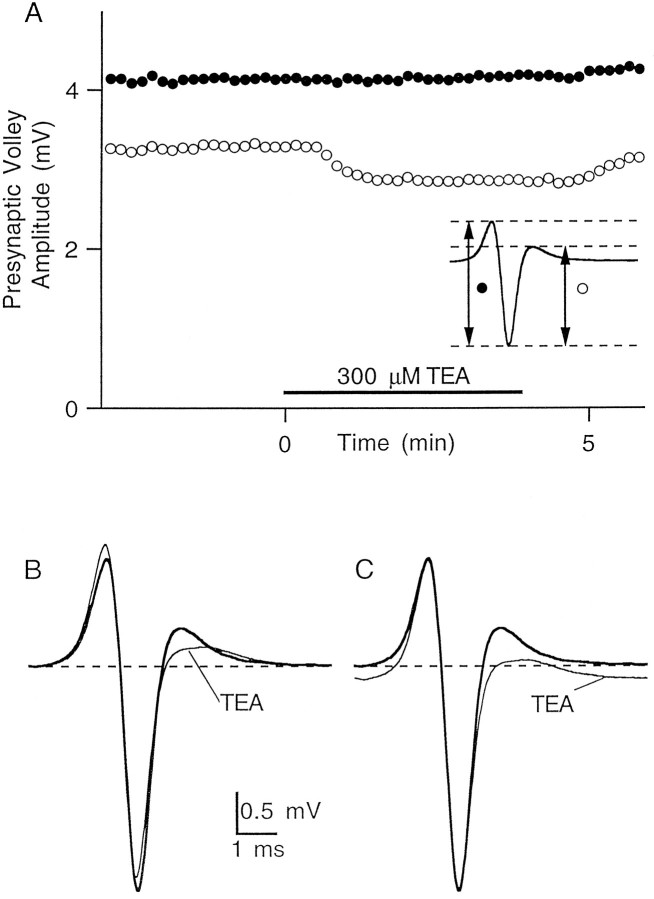
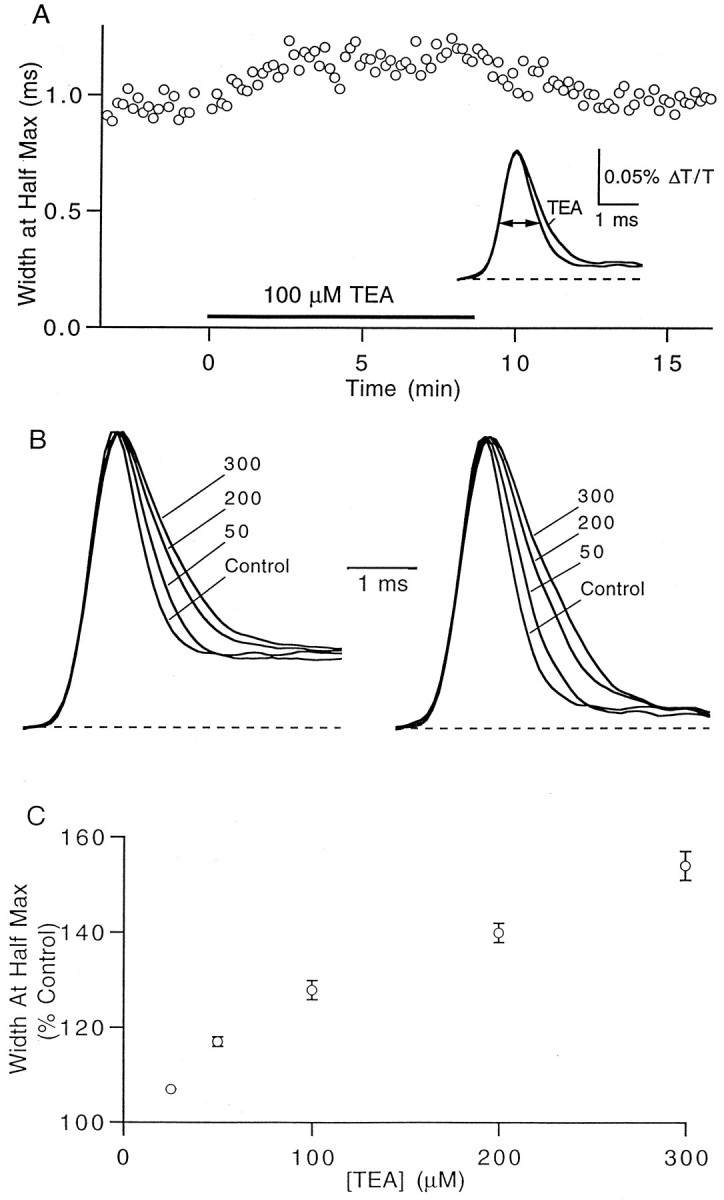
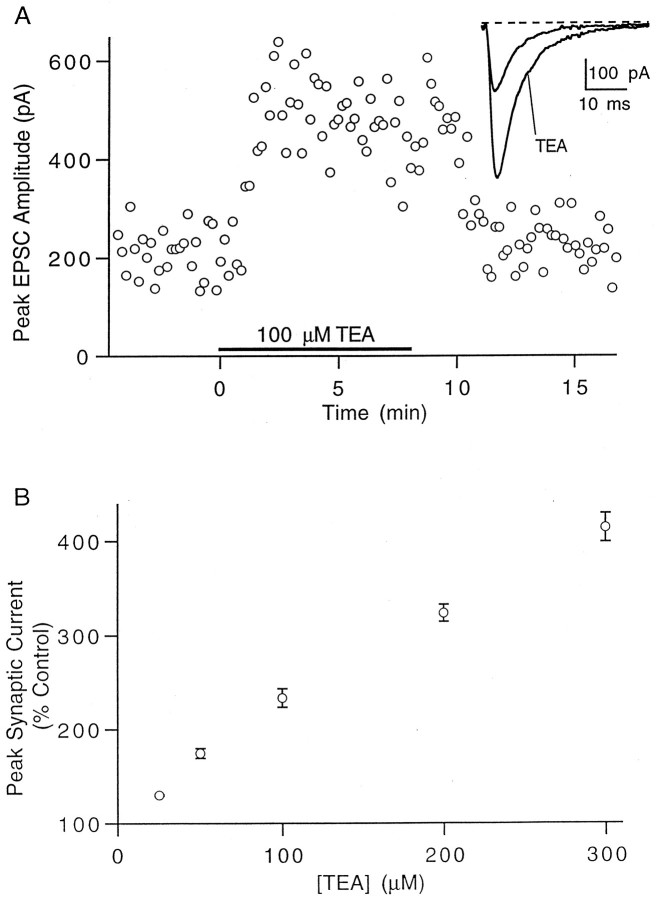
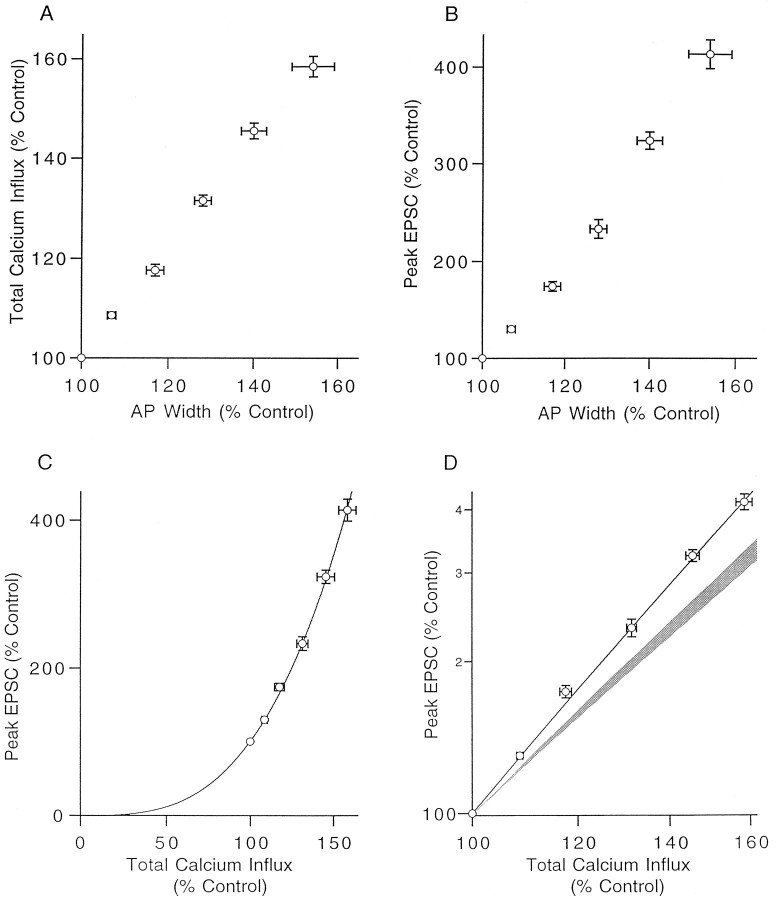
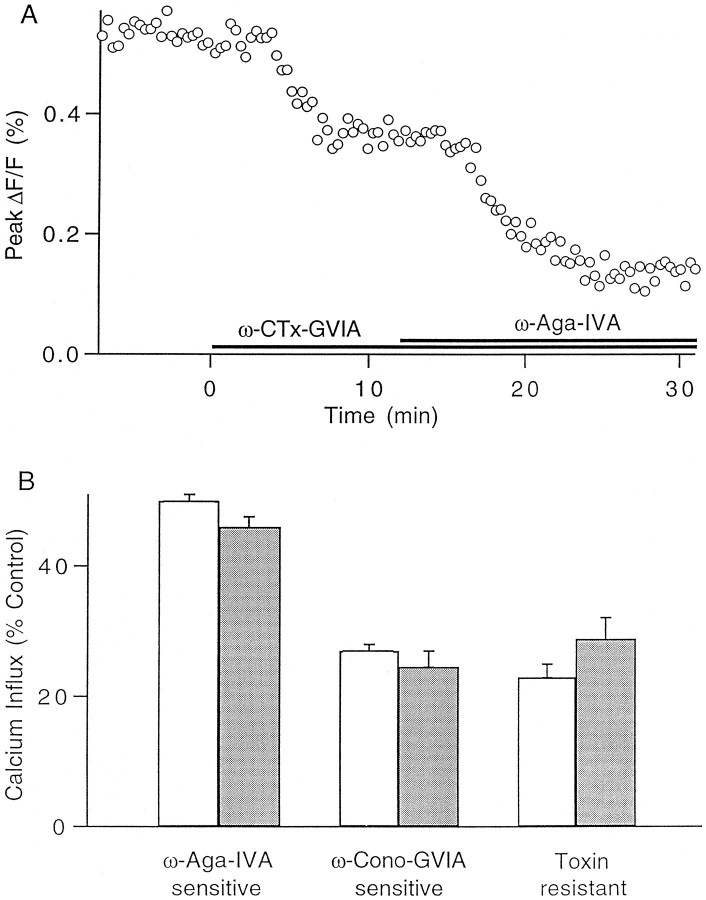
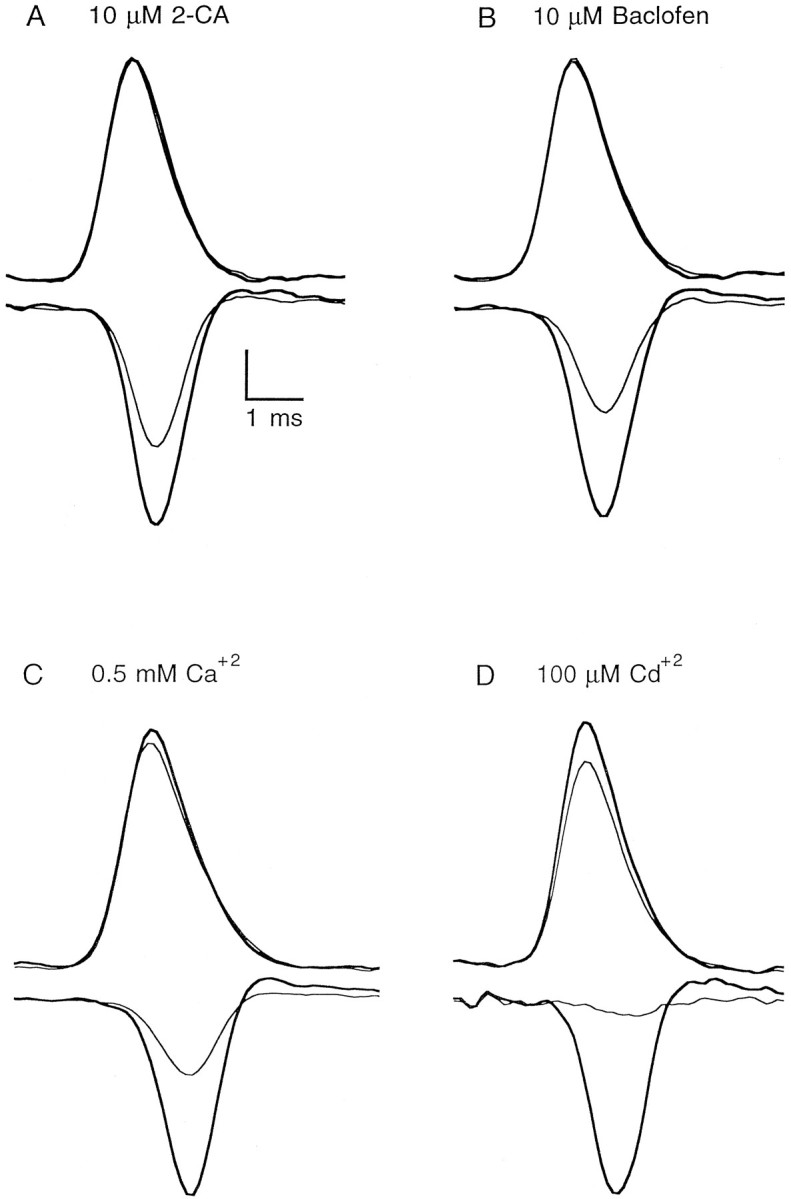
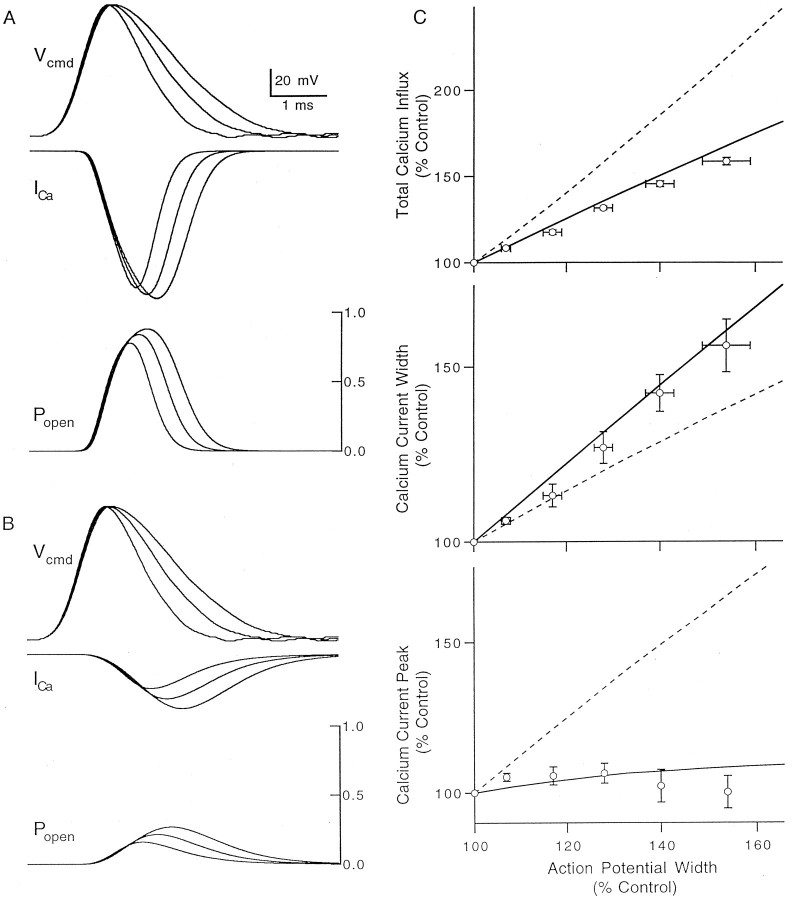
The effect of changes in the shape of the presynaptic action potential on neurotransmission was examined at synapses between granule and Purkinje cells in slices from the rat cerebellum. Low concentrations of tetraethylammonium were used to broaden the presynaptic action potential. The presynaptic waveform was monitored with voltage-sensitive dyes, the time course and amplitude of presynaptic calcium entry were determined with fluorescent calcium indicators, and EPSCs were measured with a whole-cell voltage clamp. Spike broadening increased calcium influx primarily by prolonging calcium entry without greatly affecting peak presynaptic calcium currents, indicating that the majority of calcium channels reach maximal probability of opening in response to a single action potential and that spike broadening increases the open time of these channels. EPSCs were exquisitely sensitive to elevations of calcium influx produced by spike broadening; there was a high power relationship between calcium influx and release such that a 23% increase in spike width led to a 25% increase in total calcium influx, which in turn doubled synaptic strength. The finding that even small changes in spike width influence neurotransmitter release suggests that altering the presynaptic waveform may be an important means of modifying the strength of this synapse. Waveform changes do not, however, contribute significantly to presynaptic modulation via activation of adenosine A1 or GABAB receptors. Furthermore, greatly reducing presynaptic calcium influx did not alter the presynaptic waveform, indicating that calcium channels and calcium-activated channels do not participate in shaping the presynaptic waveform.


Figures

Fig. 1.
Fig. 1.
Recording the presynaptic waveform with voltage-sensitive dyes. A, Simultaneously recorded RH482 transmittance transients (top) and extracellular field potentials (bottom) after stimulation of the molecular layer. B, Comparison of the time course of the field potential (thick line) with that of the second derivative of the voltage-sensitive dye signal (thin line). Traces are averages of 130 trials. C, Transmittance transients of bath-loaded RH482 during trains of one to four stimuli delivered at 100 Hz to the molecular layer (average of 20 trials). D, Fluorescence transients from parallel fibers focally loaded with Di-8-ANEPPS and stimulated one to four times at 100 Hz (average of 18 trials).
Fig. 4.
Fig. 4.
Simultaneous recordings of presynaptic action potential waveform and presynaptic calcium entry. Each panel shows the presynaptic waveform (top), presynaptic calcium transient (middle), and presynaptic calcium current (bottom) in control conditions (thick line) and in the presence of the indicated concentration of TEA (thin line). Vertical scale bar, 0.10–0.15% ΔT/T for RH482, 3% ΔF/F for magnesium green, and 2 (%ΔF/F)/msec for the derivatives of magnesium green signals.
Fig. 5.
Fig. 5.
The effect of spike broadening on presynaptic calcium entry. A, Representative experiment showing the effects of 100 μm TEA on total calcium influx (top), width at half-maximum amplitude of the calcium current (middle), and peak calcium current (bottom). Insets, Fluorescence transients (top) and derivatives of fluorescence transients (middle) in control conditions and in the presence of TEA. B, Dose dependence of the effects of TEA on total presynaptic calcium influx (open circles) and on the half-width (filled circles) and peak amplitude (squares) of the calcium current. Data points are mean ± SEM of 5 to 11 experiments.
Fig. 2.
Fig. 2.
Application of TEA slows action potential repolarization without significantly altering presynaptic fiber excitability. A, Application of 300 μm TEA has no effect on the magnitude of the negative-going phase of the field potential (filled circles) but decreases the magnitude of the subsequent positive-going phase (open circles). Inset, The two measured amplitudes of the field potential. B, Field potential recordings in control conditions and in the presence of TEA. C, Same traces as in B aligned for ease of comparison of amplitude and time course.
Fig. 3.
Fig. 3.
TEA broadens the presynaptic action potential.A, The width at half-maximum amplitude of the presynaptic action potential increases during application of 100 μm TEA. Inset, RH482 transmittance transients in control and TEA conditions (average of 30 trials).B, Representative experiment showing the effects of the indicated concentrations of TEA (in micromolar concentrations) on the presynaptic waveform. The first (left) and second (right) action potentials in a pair separated by 10 msec were broadened by equal amounts. The amplitudes of the transients have been normalized. C, Dose dependence of the increase in action potential duration of the first spike. Data points are mean ± SEM of five experiments.
Fig. 6.
Fig. 6.
Increase in the magnitude of synaptic currents by TEA. A, Representative experiment showing the effect of 100 μm TEA on the EPSC amplitude. Inset,Currents in control conditions and in the presence of TEA (average of 20 trials). B, Dose dependence of the increase in synaptic currents. Data points are mean ± SEM of five to eight experiments.
Fig. 7.
Fig. 7.
TEA has no effect on spontaneous miniature EPSC frequency and amplitude. A, mEPSCs recorded at a holding potential of −70 mV in control conditions (top), in the presence of 200 μm TEA (middle), and after washout of TEA (bottom). TTX was present throughout the experiment. B, mEPSC amplitude distribution histogram in control conditions (thin line) and in the presence of TEA (thick line). Inset, Normalized cumulative amplitude distributions in control conditions (thin line) and in TEA (thick line) do not differ significantly (p = 0.97 by Kolmogorov–Smirnov test). Changing the holding potential caused a readily detectable decrease in mEPSC amplitude (p < 0.05) for this experiment (data not shown). Data are from 400 sec of recording with 1499 events in the control distribution and 1443 events for the TEA distribution.
Fig. 8.
Fig. 8.
The relationship between action potential duration, calcium influx, and EPSC amplitude. A, The effect of TEA on total presynaptic calcium influx is plotted as a function of its effects on presynaptic action potential duration as measured by the width at half-maximum. B, Synaptic strength plotted as a function of action potential width (percentage of control). C, Relationship between presynaptic calcium influx and postsynaptic response when calcium influx is increased by spike broadening. D, Same data as in Cplotted on a log–log plot to demonstrate the power law relationship. The solid lines in C and Dshow the relationship described by Equation 1 withn = 3.1. The shaded regionrepresents the relationship between calcium influx and release found previously when calcium influx was altered by changing extracellular calcium concentration or by blocking calcium influx with cadmium (Mintz et al., 1995).
Fig. 9.
Fig. 9.
Relative calcium influx through different channel types is unchanged by spike broadening. A, Representative experiment showing the effect on total calcium influx of an application of ω-conotoxin-GVIA, followed by a coapplication of ω-conotoxin-GVIA and ω-Aga-IVA. The experiment was performed in the presence of 1 mm external calcium and 200 μmTEA. B, The percentages of calcium influx that are ω-conotoxin-GVIA sensitive, ω-Aga-IVA sensitive, and toxin resistant are plotted for 2 mm external Ca (white bars) and in the presence of 1 mm external calcium and 200 μm TEA (gray bars). Error bars, SEM (n = 5).
Fig. 10.
Fig. 10.
Effects of modulators of synaptic strength on presynaptic waveform and presynaptic calcium current. Each panel shows the presynaptic waveform (top) and presynaptic calcium current (bottom) in control conditions (thick line) and after the indicated manipulation (thin line). Vertical scale bar, 0.06–0.1% ΔT/T for RH482 transmittance transients and 1.0–2.5 (%ΔF/F)/msec for the derivatives of magnesium green fluorescence transients.
Fig. 11.
Fig. 11.
Simulations of calcium channel activation.A, Simulations showing the effect of the imposed command voltages (top) on the calcium current (middle) and the fraction of open calcium channels (bottom). The waveforms used in this simulation are the same as the one measured in control conditions and two versions of it broadened to correspond to the waveforms seen in 100 μmand 300 μm TEA. The action potentials have been scaled to have an amplitude of 100 mV and a resting potential of −70 mV. The calcium channel kinetics was simulated with a two-state model as described in Materials and Methods. B, Simulation as inA, but with calcium channel kinetics slowed by a factor of 5. Calcium currents in A and B are shown on the same scale. C, Total calcium influx (top), calcium current half-width (middle), and peak calcium current (bottom) plotted as a function of action potential half-width. The symbols show experimental data from Figures 5 and 8, and lines show the results produced by the simulation parameters used in A (solid line) andB (dashed line).

Similar articles

Cited by

References

    1. Atluri PP, Regehr WG. Determinants of the time course of facilitation at the granule cell to Purkinje cell synapse. J Neurosci. 1996;16:5661–5671. - PMC - PubMed
    1. Augustine G. Regulation of transmitter release at the squid giant synapse by presynaptic delayed rectifier potassium current. J Physiol (Lond) 1990;431:343–364. - PMC - PubMed
    1. Augustine GJ, Adler EM, Charlton MP. The calcium signal for transmitter secretion from presynaptic nerve terminals. In: Stanley EF, Nowycky MC, Triggle DJ, editors. Calcium entry and action at the presynaptic nerve terminal. New York Academy of Sciences; New York: 1991. pp. 365–381. - PubMed
    1. Bean BP. Neurotransmitter inhibition of neuronal calcium currents by changes in channel voltage dependence. Nature. 1989;340:153–156. - PubMed
    1. Borst JGG, Sakmann B. Calcium influx and transmitter release in a fast CNS synapse. Nature. 1996;383:431–434. - PubMed

Publication types

MeSH terms

LinkOut - more resources