. 1997 May 15;17(10):3503-14.
doi: 10.1523/JNEUROSCI.17-10-03503.1997.

Downregulation of tetrodotoxin-resistant sodium currents and upregulation of a rapidly repriming tetrodotoxin-sensitive sodium current in small spinal sensory neurons after nerve injury

Affiliations

Downregulation of tetrodotoxin-resistant sodium currents and upregulation of a rapidly repriming tetrodotoxin-sensitive sodium current in small spinal sensory neurons after nerve injury

T R Cummins et al. J Neurosci. .

Abstract

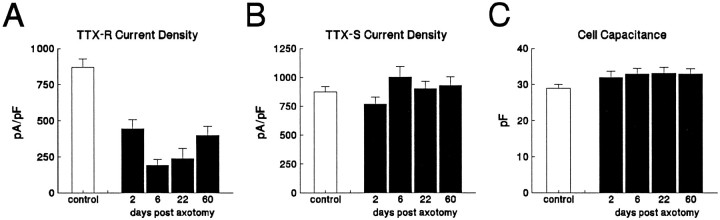
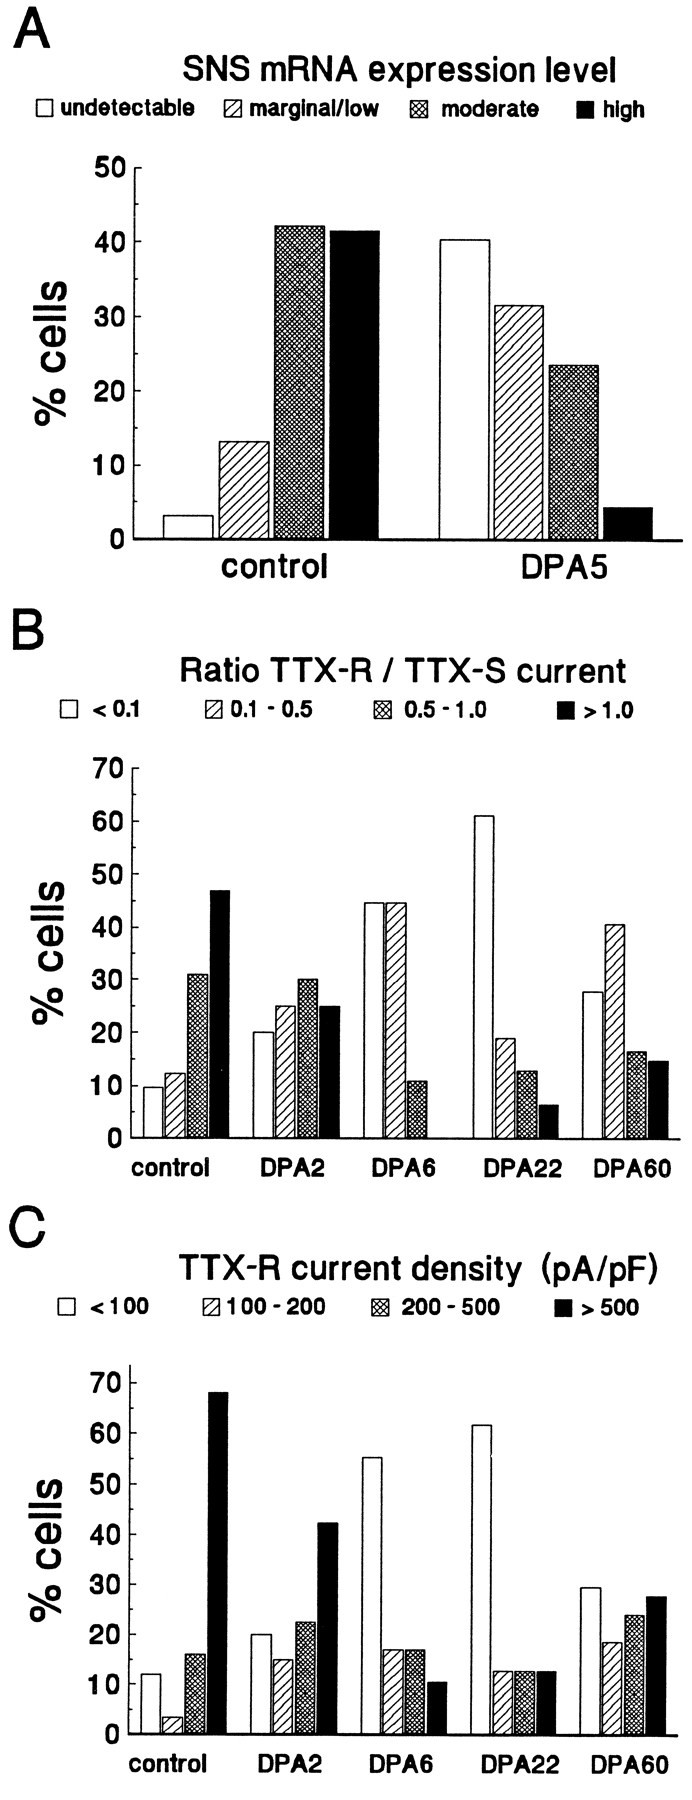
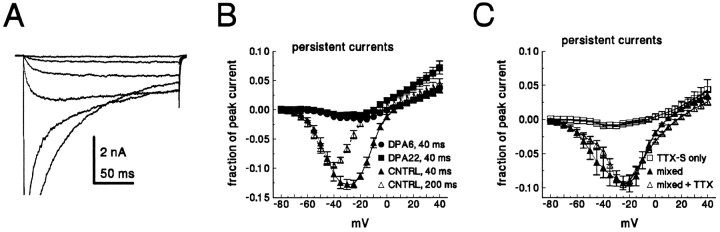
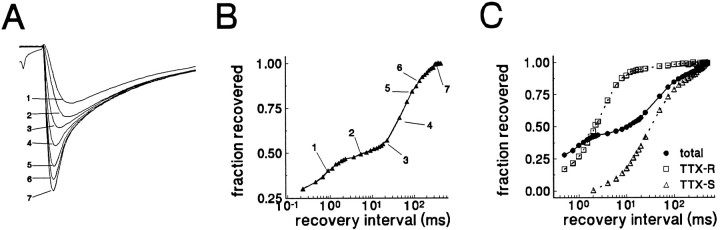
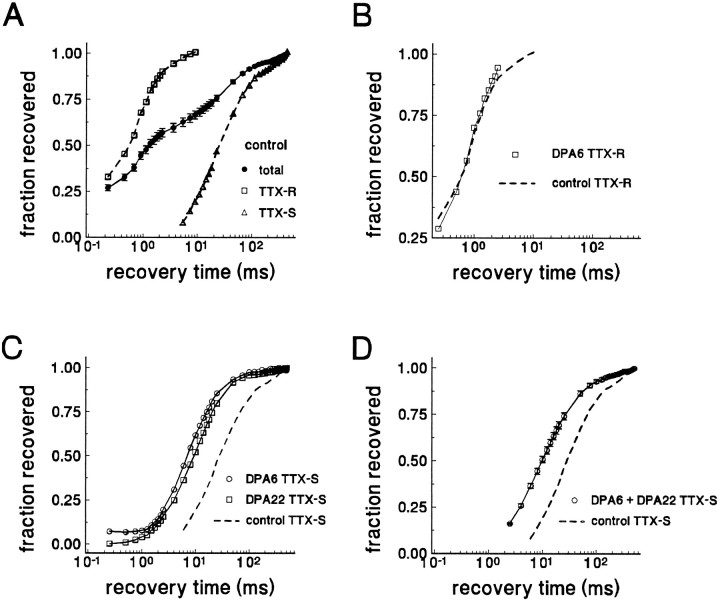
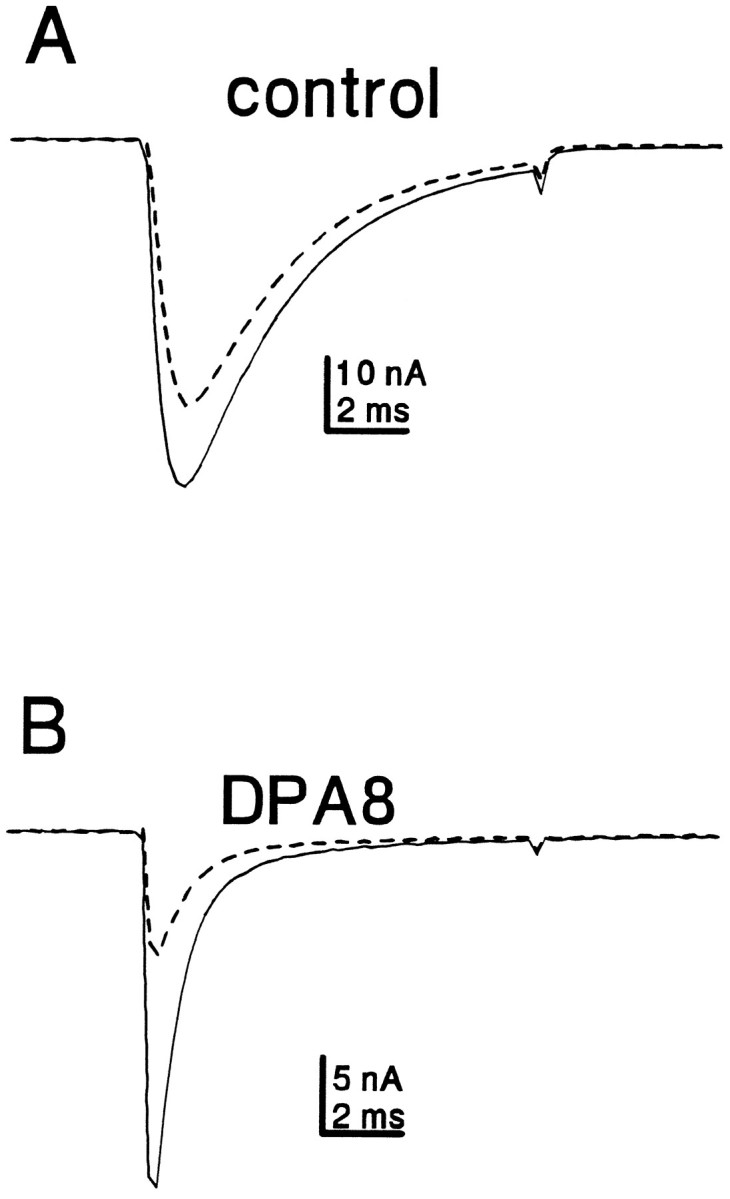
Clinical and experimental studies have shown that spinal sensory neurons become hyperexcitable after axonal injury, and electrophysiological changes have suggested that this may be attributable to changes in sodium current expression. We have demonstrated previously that sodium channel alpha-III mRNA levels are elevated and sodium channel alpha-SNS mRNA levels are reduced in rat spinal sensory neurons after axotomy. In this study we show that small (C-type) rat spinal sensory neurons express sodium currents with dramatically different kinetics after axotomy produced by sciatic nerve ligation. Uninjured C-type neurons express both slowly inactivating tetrodotoxin-resistant (TTX-R) sodium current and a fast-inactivating tetrodotoxin-sensitive (TTX-S) current that reprimes (recovers from inactivation) slowly. After axotomy, the TTX-R current density was greatly reduced. No difference was observed in the density of TTX-S currents after axotomy, and their voltage dependence was not different from controls. However, TTX-S currents in axotomized neurons reprimed four times faster than control TTX-S currents. These data indicate that axotomy of spinal neurons is followed by downregulation of TTX-R current and by the emergence of a rapidly repriming TTX-S current and suggest that this may be attributable to the upregulation of a sodium channel isoform that was unexpressed previously in these cells. These axotomy-induced changes in sodium currents are expected to alter excitability substantially and could underlie the molecular pathogenesis of some chronic pain syndromes associated with injury to the axons of spinal sensory neurons.


Figures

Fig. 1.
Fig. 1.
Axotomy alters the inactivation kinetics and voltage dependence of inactivation of C-type DRG neurons. Left column, Families of traces from representative control and axotomized C-type neurons are shown. Faster inactivation kinetics are observed for the total sodium current in axotomized neurons. The currents were elicited by 20 msec test pulses to −10 mV after 500 msec prepulses to potentials over the range of −130 mV to −10 mV.Middle column, The corresponding steady-state inactivation curves are shown for each cell. Current is plotted as a fraction of peak current. In the control neuron the midpoint for steady-state inactivation (Vh) is −38 mV. At DPA2 Vh is −62 mV, and atDPA6 and DPA22 Vh is −65 mV. At DPA60 Vh is −50 mV. However, two current components can be resolved easily in the control, DPA2,DPA22, and DPA60 cells: a slowly inactivating component that has a relatively depolarized voltage dependence of inactivation and a fast-inactivating component that has a more negative Vh. The steady-state inactivation curves for these cells are bimodal because of the different inactivation properties of the two components (arrow in B indicates point of inflection). The DPA6 cell, on the other hand, appears to exhibit only fast-inactivating currents, and the steady-state inactivation is not inflected. Right column, Repriming (recovery from inactivation) is shown for each cell. Changes in repriming are described in detail in the text and in Figure 8.
Fig. 2.
Fig. 2.
Tetrodotoxin (TTX) sensitivity of fast-inactivating and slowly inactivating currents in control neurons and neurons after axotomy. Representative current traces are shown for a control neuron (A, B) and neurons atDPA22 (C, D) and DPA60(E, F). C-type neurons were held at −100 mV and stepped to 0 mV for 50 msec. Current traces are shown before (solid trace) and after (dashed trace) 100 nm TTX (A, C, E). TheTTX-S component, obtained by using digital subtraction of the traces in A, C, and E, is shown in B, D, and F. The slow component is TTX-resistant, and the fast component is TTX-sensitive in all three groups.
Fig. 3.
Fig. 3.
Separation of TTX-S and TTX-R currents. Current traces were recorded from a control neuron before (A) and after (B) addition of 100 nm TTX to the bath solution. The currents were elicited by 20 msec test pulses to −10 mV after 500 msec prepulses to potentials over the range of −130 mV to −10 mV. C, The TTX-S component was obtained by digitally subtracting the data in B from A. D, The TTX-S currents were obtained by subtracting the data inA obtained with the −50 mV prepulse from the data inA obtained with more hyperpolarized prepulses.E, The steady-state inactivation (h∞) curve for the total current in A is shown (•). Theh∞ curves for the TTX-S and TTX-R components estimated with either TTX subtraction (□, TTX-R; ▵, TTX-S) or prepulse subtraction (▪, TTX-R; ▴, TTX-S) also are shown in E. Data were normalized to unity.
Fig. 4.
Fig. 4.
Axotomy decreases TTX-R current density. The TTX-S and TTX-R current densities were estimated in control (n = 113), DPA2 (n = 40), DPA6 (n = 30), DPA22 (n = 33), and DPA60 (n = 47) C-type neurons by using prepulse inactivation (500 msec prepulses) and a 0 mV test pulse. The TTX-R (A) and TTX-S (B) current densities were obtained by dividing the estimated peak current by the whole-cell capacitance. The TTX-R current density was significantly lower for the axotomized neurons at each time point (A). The TTX-S current density was not affected significantly by axotomy (B). Axotomy also did not alter cell capacitance significantly (C). Error bars indicate mean ± SD.
Fig. 5.
Fig. 5.
Axotomy has a similar effect on SNS mRNA expression and on TTX-R current expression. A, The relative magnitude of SNS expression was measured in culturedcontrol and DPA5 C-type neurons by in situ hybridization (Dib-Hajj et al., 1996). Expression was classified as either undetectable, marginal/low, moderate, or high.B, The ratio of the TTX-R current density to TTX-S current density is shown for control and axotomized neurons at DPA2, DPA6,DPA22, and DPA60. Cells were classified according to the ratio. C, Shown is the TTX-R current density for control and axotomized neurons atDPA2, DPA6, DPA22, andDPA60. Cells were assigned to one of four groups for each time point on the basis of TTX-R current density.
Fig. 6.
Fig. 6.
Axotomy decreases persistent currents in C-type neurons. A, Family of currents recorded from a control small DRG neuron. Current was elicited by test potentials from −75 to −25 in 10 mV steps. The peak current in this cell was 47 nA.B, Current–voltage relationship for the persistent current in small DRG neurons. Cells were held at −100 mV and stepped to step voltages from −80 to 40 mV for 40 msec. The average current measured from 38 to 40 msec was normalized to the maximum peak current for each cell and is plotted against the test voltage. Data are shown for control (▴, n = 12), DPA6 (•,n = 14), and DPA22 (▪, n = 14). Axotomized cells in the DPA6 and DPA22 groups were identified with a fluorescent label. For the control neurons the persistent current also was measured by using 200 msec test depolarizations (▵,n = 11). C, The persistent current in control neurons (n = 4) that express both TTX-S and TTX-R currents is shown before (▴) and after (▵) 100 nm TTX. In control neurons that express only TTX-S currents (n = 5), the persistent currents were small (□). Persistent currents were measured at 38–40 msec, as in A.
Fig. 7.
Fig. 7.
Recovery from inactivation has multiple components in control neurons. A, Data from a typical control C-type neuron are shown. The cell was held at −100 mV, stepped to 0 mV for 20 msec to inactivate channels, and then brought back to −100 mV for increasing durations before the test potential of 0 mV. Current traces shown in A correspond to specific time points in the recovery time course shown in B. The time course of recovery exhibited at least two components. The TTX-R component (traces1 and 2) recovered rapidly, with a time constant of 0.7 msec. The TTX-S component recovered slowly (traces57), with a time constant of 87 msec. C, Data from another control neuron are shown. The time course of recovery is shown for the total current (•) and for the separated TTX-R (□) and TTX-S components (▵). The TTX-R time course was obtained in the presence of 100 nm TTX. The TTX-S time course was obtained by subtracting the currents recorded with TTX from the data obtained without TTX.
Fig. 8.
Fig. 8.
The kinetics of recovery from inactivation for TTX-S current, but not for TTX-R current, are different in axotomized neurons. A, The averaged time course of recovery from inactivation for total current from control C-type neurons that expressed both TTX-S and TTX-R currents is shown (•, n = 45). At least two components can be distinguished. The time course of the rapid repriming component from control neurons with predominantly TTX-R (>75%) current is plotted separately (□, n = 11). The time course for the slow component (obtained by digitally subtracting the current recovered after 6 msec) in control cells expressing large TTX-S (>1nA/pF) currents also is shown (▵, n = 12).B, The repriming time course of the TTX-R component in an axotomized neuron (DPA6) is shown (□). For comparison, the averaged repriming time course of the TTX-R components from control neurons also is shown (dashed curve). Recovery from inactivation for the TTX-R current does not shift after axotomy. C, The time course of recovery from inactivation for injured DPA6 (○) and DPA22 (□) C-type neurons that expressed predominantly TTX-S currents is shown. For comparison, the repriming time course for the TTX-S current of control neurons also is shown (dashed curve). Note the leftward shift in the time course for recovery from inactivation for the TTX-S current after axotomy. D, The averaged time course for recovery of the TTX-S current from inactivation in Fluoro-gold-identified axotomized DPA6 and DPA22 neurons (n = 30) is shown (○). For comparison, the repriming time course for the TTX-S current of control neurons also is shown (dashed curve).
Fig. 9.
Fig. 9.
Axotomy increases the relative sensitivity of C-type neurons to frequency-dependent inhibition by lidocaine. Representative traces from a control (A) and DPA8 (B) neuron are shown. Cells were exposed to 50 μm lidocaine. After 5 min, the cells were stimulated with a 10 Hz train of 20 depolarizations (to 0 mV for 10 msec). The currents elicited by the first (solid trace) and 20th (dashed trace) depolarizations are shown.

Similar articles

Cited by

References

    1. Akopian AN, Sivilotti L, Wood JN. A tetrodotoxin-resistant voltage-gated sodium channel expressed by sensory neurons. Science. 1996;379:257–262. - PubMed
    1. Appelgren L, Janson M, Nitescu P, Curelaru I. Continuous intracisternal and high cervical intrathecal bupivacaine analgesia in refractory head and neck pain. Anesthesiology. 1996;84:256–272. - PubMed
    1. Black JA, Dib-Hajj S, McNabola K, Jeste S, Rizzo MA, Kocsis JD, Waxman SG. Spinal sensory neurons express multiple sodium channel α-subunit mRNAs. Mol Brain Res. 1996;43:117–132. - PubMed
    1. Boas RA, Covino BG, Shahnarian A. Analgesic responses to i.v. lignocaine. Br J Anaesth. 1982;54:501–505. - PubMed
    1. Burchiel KJ. Carbamazepine inhibits spontaneous activity in experimental neuromas. Exp Neurol. 1988;102:249–253. - PubMed

Publication types

MeSH terms

LinkOut - more resources