. 1997 May 15;17(10):3538-53.
doi: 10.1523/JNEUROSCI.17-10-03538.1997.

Mechanisms and effects of intracellular calcium buffering on neuronal survival in organotypic hippocampal cultures exposed to anoxia/aglycemia or to excitotoxins

Affiliations

Mechanisms and effects of intracellular calcium buffering on neuronal survival in organotypic hippocampal cultures exposed to anoxia/aglycemia or to excitotoxins

K M Abdel-Hamid et al. J Neurosci. .

Abstract

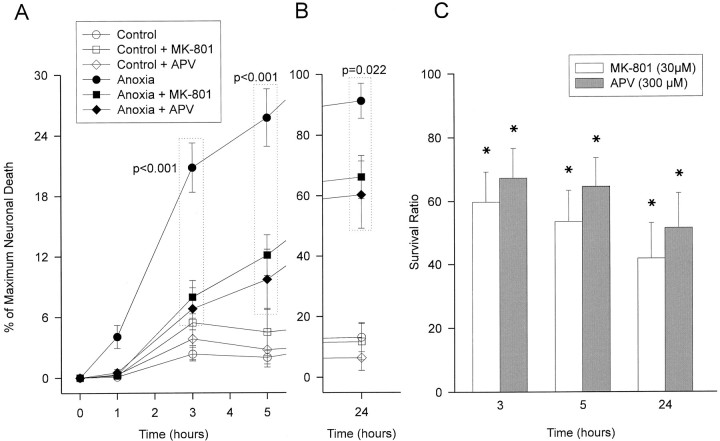
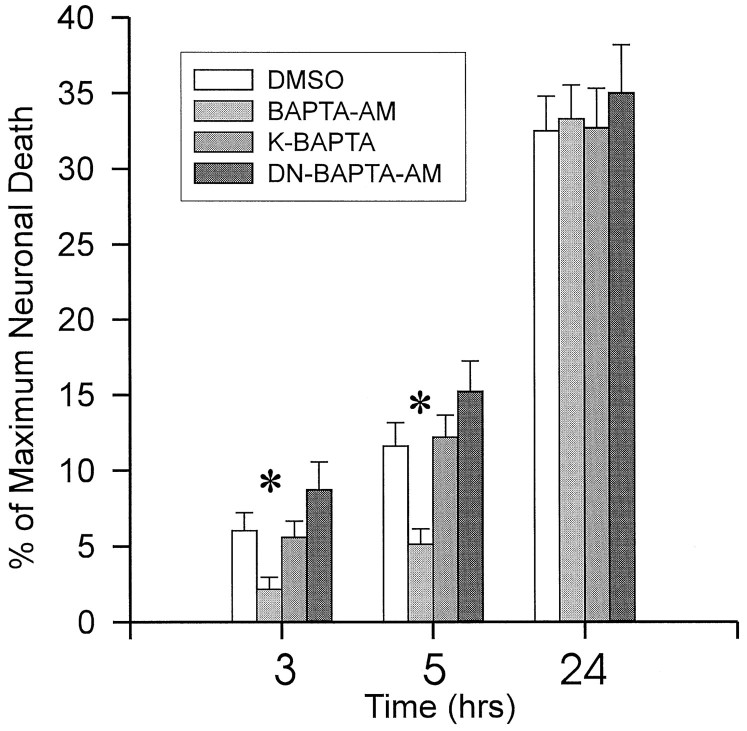
Neuronal calcium loading attributable to hypoxic/ischemic injury is believed to trigger neurotoxicity. We examined in organotypic hippocampal slice cultures whether artificially and reversibly enhancing the Ca2+ buffering capacity of neurons reduces the neurotoxic sequelae of oxygen-glucose deprivation (OGD), whether such manipulation has neurotoxic potential, and whether the mechanism underlying these effects is pre- or postsynaptic. Neurodegeneration caused over 24 hr by 60 min of OGD was triggered largely by NMDA receptor activation and was attenuated temporarily by pretreating the slices with cell-permeant Ca2+ buffers such as 1, 2 bis(2-aminophenoxy)ethane-N,N,N',N'-tetra-acetic acid acetoxymethyl ester (BAPTA-AM). This pretreatment produced a transient, reversible increase in intracellular buffer content as demonstrated autoradiographically using slices loaded with 14C-BAPTA-AM and by confocal imaging of slices loaded with the BAPTA-AM analog calcium green-acetoxymethyl ester (AM). The time courses of 14C-BAPTA retention and of neuronal survival after OGD were identical, indicating that increased buffer content is necessary for the observed protective effect. Protection by Ca2+ buffering originated presynaptically because BAPTA-AM was ineffective when endogenous transmitter release was bypassed by directly applying NMDA to the cultures, and because pretreatment with the low Ca2+ affinity buffer 2-aminophenol-N,N,O-triacetic acid acetoxymethyl ester, which attenuates excitatory transmitter release, attenuated neurodegeneration. Thus, in cultured hippocampal slices, enhancing neuronal Ca2+ buffering unequivocally attenuates or delays the onset of anoxic neurodegeneration, likely by attenuating the synaptic release of endogenous excitatory neurotransmitters (excitotoxicity).


Figures

Fig. 1.
Fig. 1.
Characterization of organotypic hippocampal slice culture model. A, Anoxic vulnerability is maximal in 12 DIV or older cultures exposed to OGD, achieved by combining anoxia with aglycemia and 2DG. Cultures were exposed to 60 min of anoxia in the presence or absence of either d-glucose (11 mm) or 2DG (2 mm; n = 3 slices/group for 7–9 DIV, 5 slices/group for 12 DIV, 9 slices/group for 12 DIV + 2DG). Note that 60 min OGD in 12 DIV cultures caused PI fluorescence to rise to 35–40% of the maximum achieved by complete cell killing (neuronal and non-neuronal, see Materials and Methods). Sixty minutes OGD produced consistent near-total neuronal loss in the hippocampal cell layers by histological criteria (see Fig. 2). Inset, Time course of the decline in oxygen concentration after the onset of anoxia as measured with a Clarke oxygen electrode immersed in a culture well containing BSS. The electrode was calibrated at room air (20% oxygen) and in an anoxic atmosphere obtained by a 25 min flush with 95% nitrogen/5% CO2 with analyzed oxygen content of 7 parts/million in the gas phase (nominally zero oxygen). O2concentration at 3 min dropped to below 0.3%. B, PI fluorescence intensity is linearly related to the magnitude of neuronal loss (r = 0.95, p < 0.0001). Cultured 12 DIV hippocampal slices (n = 3) were exposed to OGD and fixed with 4% paraformaldehyde at 0, 5, and 24 hr after the insult. The number of pyknotic nuclei was counted in 16 high-power fields in the neuronal layers, and the counts were plotted against the PI fluorescence intensity obtained from the same fields immediately before fixation. C, PI fluorescence produced by 60 min OGD is of neuronal origin. Cultures were exposed to 500 μm NMDA (n = 8 slices) or to 500 μm each of NMDA and kainate (n = 8 slices) for 24 hr, or to either 1 or 3 hr of OGD (n = 7 and 9 slices, respectively) followed by a 24 hr incubation in BSS. PI fluorescence was normalized to that obtained from the same slices after complete cell killing. Both the NMDA and the 1 hr OGD insults produced only neuronal cell loss as gauged histologically (as in Fig. 3). The combined NMDA and kainate insult, as well as the 3 hr OGD insult, killed an additional cell population (p < 0.05, one-tailed Student’st test) that was resistant to 500 μm NMDA or 60 min of OGD, and was most likely glial, although a contribution from a small resistant neuronal population outside the neuronal layers cannot be excluded. PI fluorescence values obtained by OGD and the EAA insults were ∼40% of the maximum. Thus, the value of 40% of maximal fluorescence (horizontal dotted line) was selected in subsequent analyses as equating 100% neuronal death. D, Method of calculating cell death at a given time t from PI fluorescence images. Images of the cultures were taken before (i) and during (ii andiii) the 24 hr observation period and normalized to the maximal PI fluorescence values obtained with complete cell killing (iv). The formula shown was applied to the pooled fluorescence from the entire image or to fluorescence values derived from regions of interest (ROIs; solid lines iniv) encompassing the CA1,CA3, or dentate granule layer (DG) of the culture. ROIs were selected on the final PI image (iv) and then applied to the previous images in the same series (i–iii). Gray-level scale iniv applies to all images.
Fig. 2.
Fig. 2.
OGD causes complete neurodegeneration of all neuronal layers in organotypic hippocampal slices, whereas glucose deprivation alone does not. Cultures were maintained in BSS containing 2 μg/ml PI and exposed to anoxia/aglycemia + 2 mm 2DG (B, D, F) or to aglycemia + 2 mm 2DG without anoxia (A, C, E). After 24 hr, PI fluorescence was digitally imaged in the slices (A, B), after which they were fixed in 4% paraformaldehyde and stained with toluidine blue/acid fuchsin (C–F). No significant PI staining was observed in slices challenged with glucose deprivation alone (A), whereas OGD produced a significant increase in PI fluorescence in all neuronal layers (B). Similarly, glucose-deprived cultures exhibited normal neuronal morphology, whereas OGD-challenged slices sustained widespread neuronal loss at both low (4× objective; C, D) and high (40× objective; E, F) magnification. Thus, anoxic damage is reflected by intense PI staining (B), loss of neuronal cell layers at low magnification (D), and the replacement of neuronal outlines with pyknotic nuclei at higher magnification (F). A andB are digital, 8-bit/pixel pseudocolor images of PI fluorescence intensity, with purple andred representing low and high intensities, respectively (color bar). C–F are true-color images of the slices in A and B after staining with toluidine blue/acid fuchsin. The pale bluebackground in C and D is produced by toluidine blue staining of the membrane, on which the slices are cultured. Scale bars: 500 μm in A–D (shown inA); 75 μm in E and F(shown in E).
Fig. 4.
Fig. 4.
MK-801, an NMDA receptor antagonist, attenuates neuronal damage produced by OGD: representative experiment. Pseudocolor images of PI fluorescence in cultures exposed to OGD (left column) and to OGD combined with MK-801 (30 μm;right column) at the indicated times. The panels at thebottom illustrate the maximum achievable PI fluorescence (after a further 24 hr incubation at 4°C) used to normalize the previous measurements from the same slice. MK-801 pretreatment (15 min before the insult) improved neuronal survival (see Fig. 3).Color scale indicates the relationship between color and fluorescence intensity, with purple andred representing low and high intensities, respectively. Scale bar, 1 mm.
Fig. 3.
Fig. 3.
OGD-induced neuronal injury is partially mediated by NMDA receptor activation. Slice cultures were exposed to 60 min OGD alone (11 slices) or in the presence of 30 μm MK-801 (11 slices) or 300 μmdl-APV (9 slices). Antagonists were present from 15 min before OGD until the end of the 24 hr period. A, B, Representative series of experiments. Both antagonists equally reduced anoxic injury when compared with untreated anoxic slices (ANOVA followed by the Newman–Keuls procedure for multiple comparisons; groups included are in dotted boxes, p values marked on plot). Open symbols, Glucose deprivation in the presence of 2 mm 2DG without anoxia (no treatment, 11 slices; MK-801, 11 slices; APV, 13 slices). A, Time course of neuronal cell death at 0–5 hr. B, Extent of neuronal death at 24 hr (note differences in ordinate between A andB). C, Effect of NMDA antagonists on the survival of OGD-challenged neurons over 24 hr. Data were pooled from two series of experiments using MK-801 (22 total slices) and APV (23 slices). Protective efficacy of a treatment was expressed as a survival ratio, defined as 100 × (1 −Dtreated/Duntreated), whereDtreated/Duntreatedis the ratio of OGD-induced neuronal death in the antagonist treated and untreated groups, respectively. A value of 100 indicates that the treatment completely prevented neuronal death, whereas 0 indicates no effect of treatment. Asterisks indicate significant differences from zero.
Fig. 5.
Fig. 5.
Treating slice cultures with BAPTA-AM and BAPTA analogs results in intraneuronal chelator accumulation.A, Cellular autoradiography of the CA1 region from a 10-μm-thick section of a 14C-BAPTA-AM-loaded slice culture (40× microscope objective) counterstained with hematoxylin and eosin. The slice was loaded with 100 μm14C-BAPTA-AM (see Materials and Methods) and fixed with EDC 24 hr after loading. There was a higher density of silver grains over the cell layers (see Results). Scale bar, 40 μm. B, Confocal image of a slice culture similarly loaded with the fluorescent cell-permeant BAPTA analog calcium green-AM (25 μm), fixed after 5 hr with EDC (see Results), and sectioned (10 μm). Distinct localization of the compound was detected in cell layers. Scale bar, 300 μm. C, Higher magnification of an area from the slice in B confirms intraneuronal loading of calcium green. Scale bar, 20 μm. Data in A andB are representative of five experiments per group.
Fig. 6.
Fig. 6.
Pretreatment with BAPTA-AM temporarily protects cultured slices from OGD. The slices were pretreated with BAPTA-AM (10 or 100 μm, n = 18 and 19 slices, respectively) in a total of 0.5% DMSO or with DMSO alone. Subsequently, they were exposed to 60 min OGD. A, B, Representative series of experiments. A, OGD-induced cell death was significantly lower in both BAPTA-treated groups at 1, 3, and 5 hr after the insult compared with untreated OGD controls (n = 17 slices). B, At 24 hr, however, this protective effect of BAPTA pretreatment was no longer significant (ANOVA followed by Newman–Keuls procedure for multiple comparisons; groups included are in dotted boxes,p values marked on plot). Open symbols, Glucose deprivation without anoxia (DMSO, 10 μm and 100 μm BAPTA-AM groups, n = 9, 6, and 8 slices, respectively). C, Effect of BAPTA-AM on the survival of OGD-challenged neurons over 24 hr. Data were pooled from two series of experiments using 10 μm BAPTA-AM pretreatment (18 slices) and five series of experiments with 100 μm BAPTA-AM (66 slices). Survival ratios were calculated as in Figure 4C. At 3 and 5 hr after OGD, the survival ratios of 10 and 100 μm BAPTA-AM pretreatments were comparable to those resulting from NMDA antagonists. However, unlike with NMDA antagonists, a protective effect of BAPTA was no longer observed at 24 hr. Asterisks indicate significant differences from zero (no treatment effect).
Fig. 7.
Fig. 7.
The time course of BAPTA retention in the cultured slices parallels exactly the time course of neuroprotection. The cultures were loaded using 14C-BAPTA-AM, and the relative quantity of 14C-BAPTA in the slice tissue was assessed autoradiographically. The chelator was fixed at the different times using the cross-linker EDC (see Materials and Methods).A, Representative 14C-BAPTA autoradiographs of cultures fixed at the indicated times after loading with14C-BAPTA-AM. EDC was used for panels i–v.vi illustrates a slice similarly loaded using14C-BAPTA-AM, but fixed in 4% paraformaldehyde (PFA) rather than with EDC immediately after loading. This fixative fails to maintain the chelator in the tissue (compare with i). Scale bar, 1.2 mm. B, Densitometric quantitation of the time course of BAPTA retention. Data shown are background-subtracted mean density values obtained from at least two 14C-BAPTA-AM-loaded slices at each time point and at each group. PFA-fixed slices were not distinguishable from background. The 14C-BAPTA signal was retained in the slices for the first 5 hr and then decreased markedly by 24 hr (compare with protective efficacy, Fig. 6C). The background-corrected maximum black level of the photographic emulsion is also shown (triangles) to emphasize that the complete retention of EDC-fixed slices between 0 and 5 hr is not attributable to a saturation artifact.
Fig. 8.
Fig. 8.
Protection by BAPTA-AM is attributable to intracellular Ca2+ chelation, not to extracellular Ca2+ buffering or to the AM moiety. Slice cultures were challenged with 60 min OGD in the presence of DMSO alone (DMSO; 24 slices), BAPTA-AM (38 slices), BAPTA tetrapotassium salt (K-BAPTA; 5 slices), which is cell-impermeant, and dinitro-BAPTA-AM (DN-BAPTA-AM; 8 slices), which has a negligible affinity for Ca2+.Asterisks indicate differences from DMSO groups (ANOVA followed by Newman–Keuls procedure for multiple comparisons).
Fig. 9.
Fig. 9.
BAPTA-AM pretreatment is ineffective when neurons are directly challenged with NMDA. A, Slice cultures were pretreated with 100 μm of either BAPTA-AM, EGTA-AM, or APTRA-AM, and were then challenged with either 10, 40, or 100 μm NMDA for 60 min (9–11 slices per group). The chelators had no impact on the time course and extent of neurotoxicity produced by the mild and severe NMDA insults (10 and 100 μm NMDA, respectively). The intermediate insult (40 μm NMDA) caused increased neurodegeneration in the presence of BAPTA-AM (asterisks, p< 0.05). B, C, Representative experiments with 40 μm NMDA, in which BAPTA-AM, but not EGTA-AM or APTRA-AM, potentiated NMDA toxicity (n = 8–10 slices in NMDA groups, 4–6 slices in control groups). Dotted boxes, Groups included in ANOVA, followed by Newman–Keuls procedure for multiple comparisons (p indicates comparisons to BAPTA + NMDA-treated group).
Fig. 10.
Fig. 10.
APTRA-AM, a permeant chelator having a lower Ca2+ affinity and different structure from BAPTA-AM, is also effective. Slices were pretreated with 100 μm of either BAPTA-AM (11 slices) or APTRA-AM (9 slices). Controls were pretreated with DMSO alone (9 slices). Subsequently, the cultures were exposed to 60 min OGD. Neuronal survival at 3 and 5 hr after OGD was better in the chelator-treated groups (ANOVA on groups indicated in thedotted boxes was followed by Newman–Keuls procedure for multiple comparisons; p values indicate comparisons to chelator-untreated controls). A, Times 0–5 hr.B, Outcome at 24 hr.

References

    1. Abdel-Hamid KM (1994) The regulation of intracellular calcium in cultured hippocampal neurons and the influence of calcium buffers. PhD thesis, University of British Columbia.
    1. Adler EM, Augustine GJ, Duffy SN, Charlton MP. Alien intracellular calcium chelators attenuate neurotransmitter release at the squid giant synapse. J Neurosci. 1991;11:1496–1507. - PMC - PubMed
    1. Arkhammar P, Nilsson T, Bergmann PO. Glucose mediated efflux of indo-1 from pancreatic B-cells is reduced by probenecid. FEBS Lett. 1991;273:182–184. - PubMed
    1. Baimbridge KG, Abdel-Hamid KM. Intra-neuronal Ca2+-buffering with BAPTA enhances glutamate excitotoxicity in vitro and ischemic damage in vivo. Soc Neurosci Abstr. 1992;18:571.4.
    1. Bigelow DJ, Squier TC, Thomas DD. Temperature dependence of rotational dynamics of protein and lipid in sarcoplasmic reticulum membranes. Biochemistry. 1986;25:194–202. - PubMed

Publication types

MeSH terms

LinkOut - more resources