Classical Article
. 1997 Feb;120(4 Suppl):471-90; discussion 468-9.
doi: 10.1111/j.1476-5381.1997.tb06837.x.

The channel-blocking action of methonium compounds on rat submandibular ganglion cells. 1983

Classical Article

The channel-blocking action of methonium compounds on rat submandibular ganglion cells. 1983

A M Gurney et al. Br J Pharmacol. 1997 Feb.

Abstract

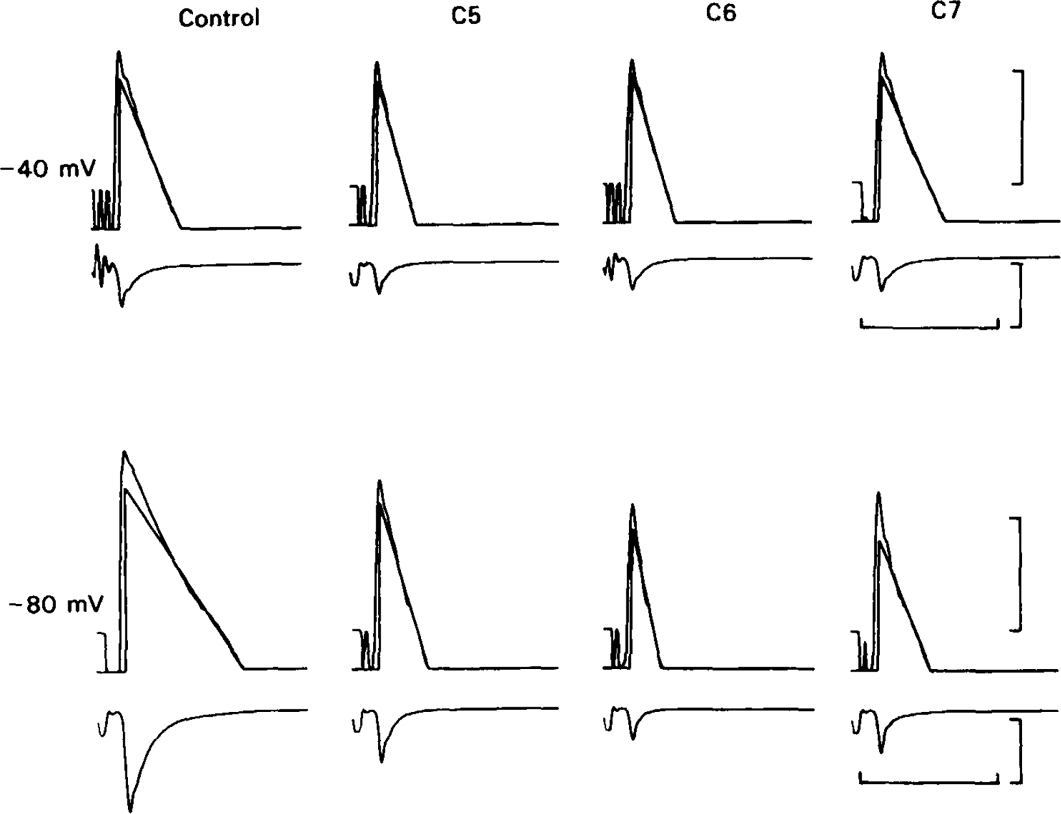
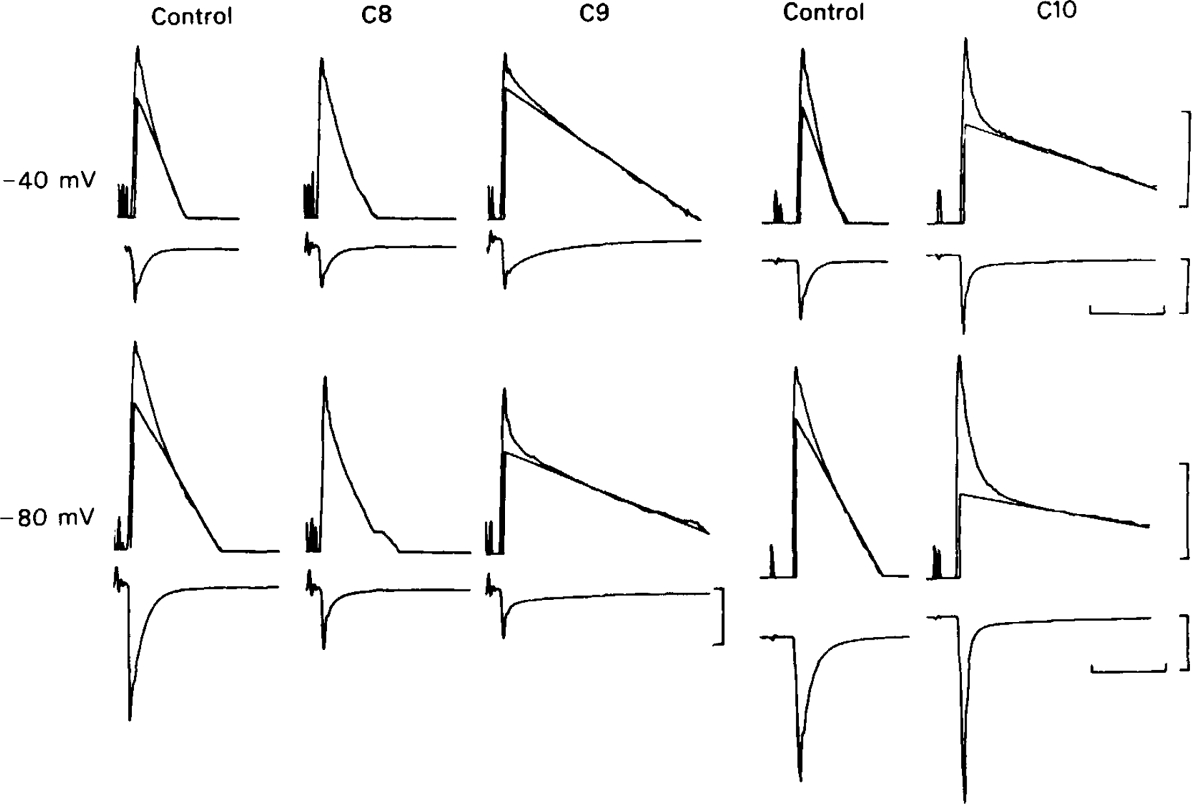
  1. The effects of drugs of the polymethylene bis-trimethylammonium (methonium) series on the characteristics of the synaptic currents (e.s.cs) recorded from voltage-clamped rat submandibular ganglion cells have been studied. The drugs studied were from C4 to C10 (decamethonium).

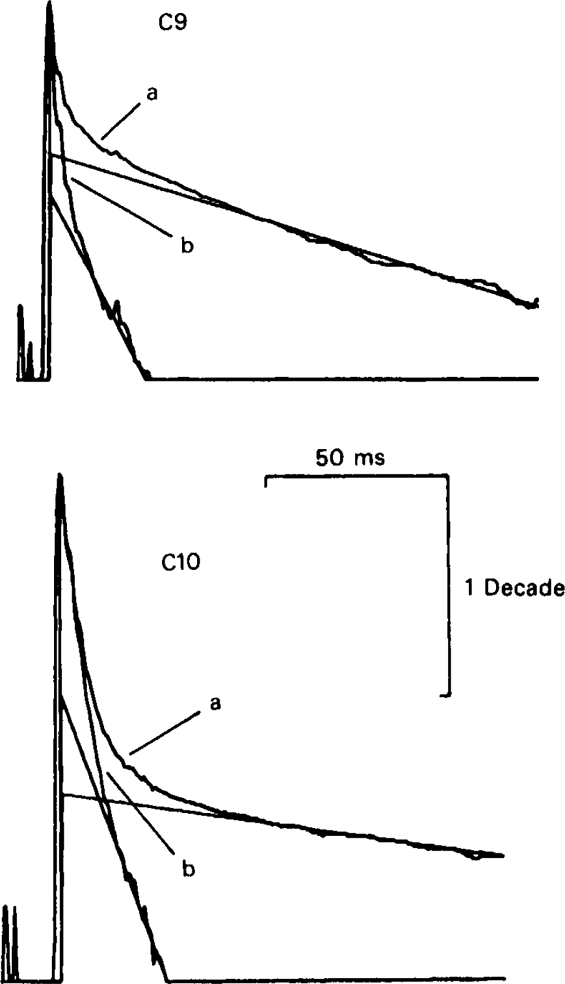
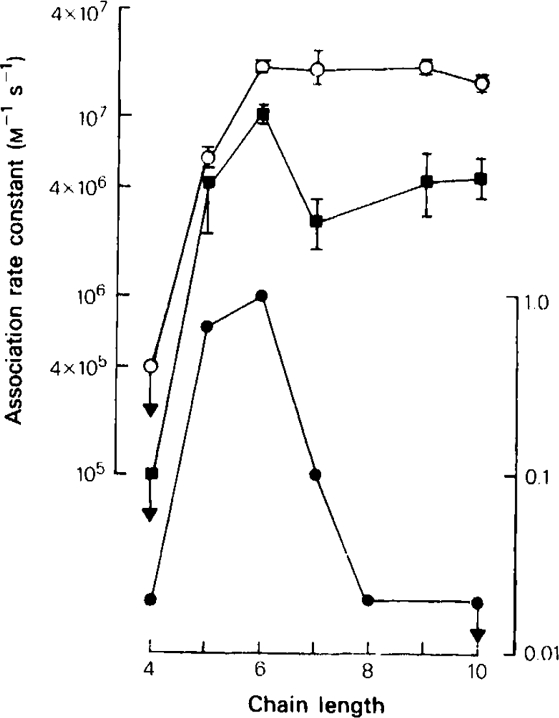
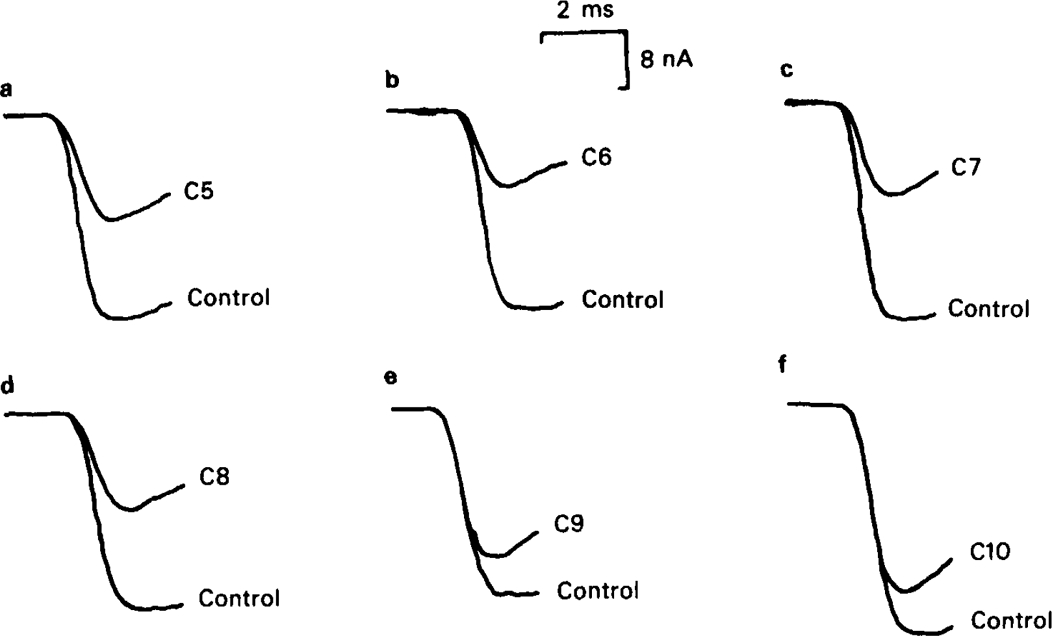
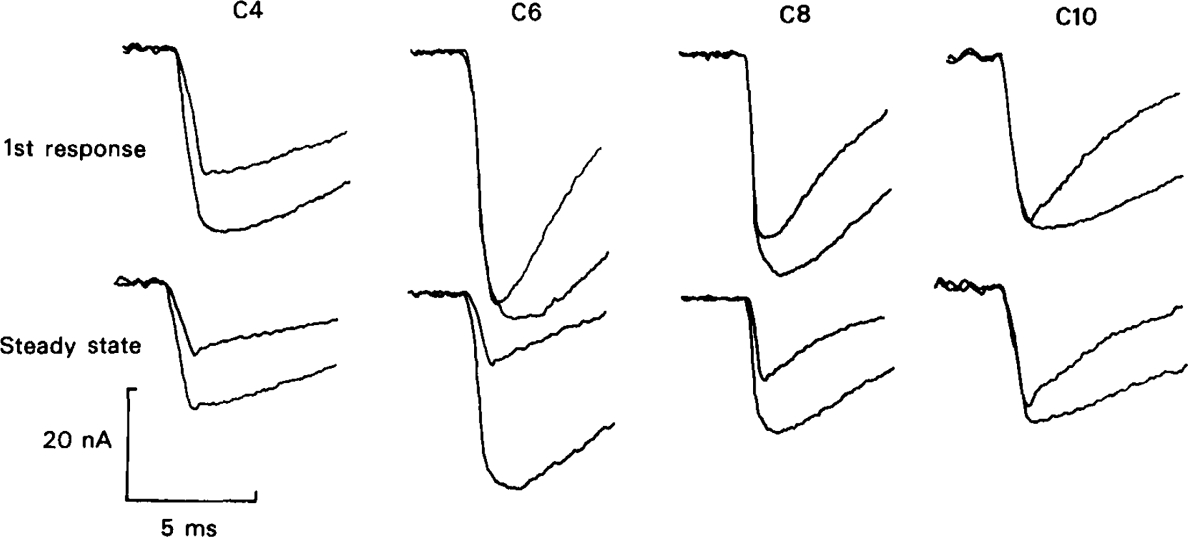
  2. All of the drugs except C4 shortened the initial decay phase of the e.s.c.; C9 and C10 produced an additional slowly decaying component. These effects were interpreted in terms of an open channel block mechanism, the calculated rate constants for association with the open channel at − 80 mV being fairly similar (5.9 × 10⁶ to 18.1 × 10⁶M−1 s−1) for all of the compounds except C4, which had no effect on the e.s.c. decay.

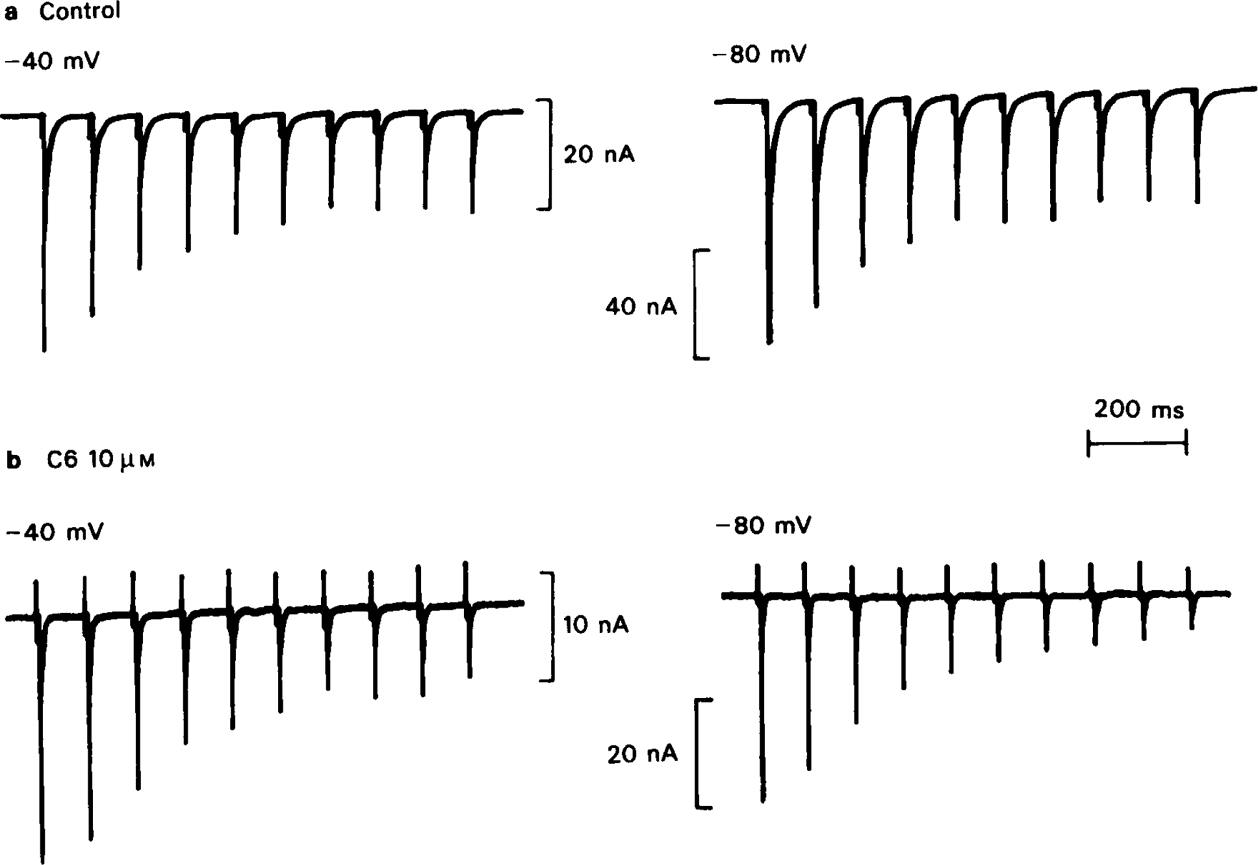
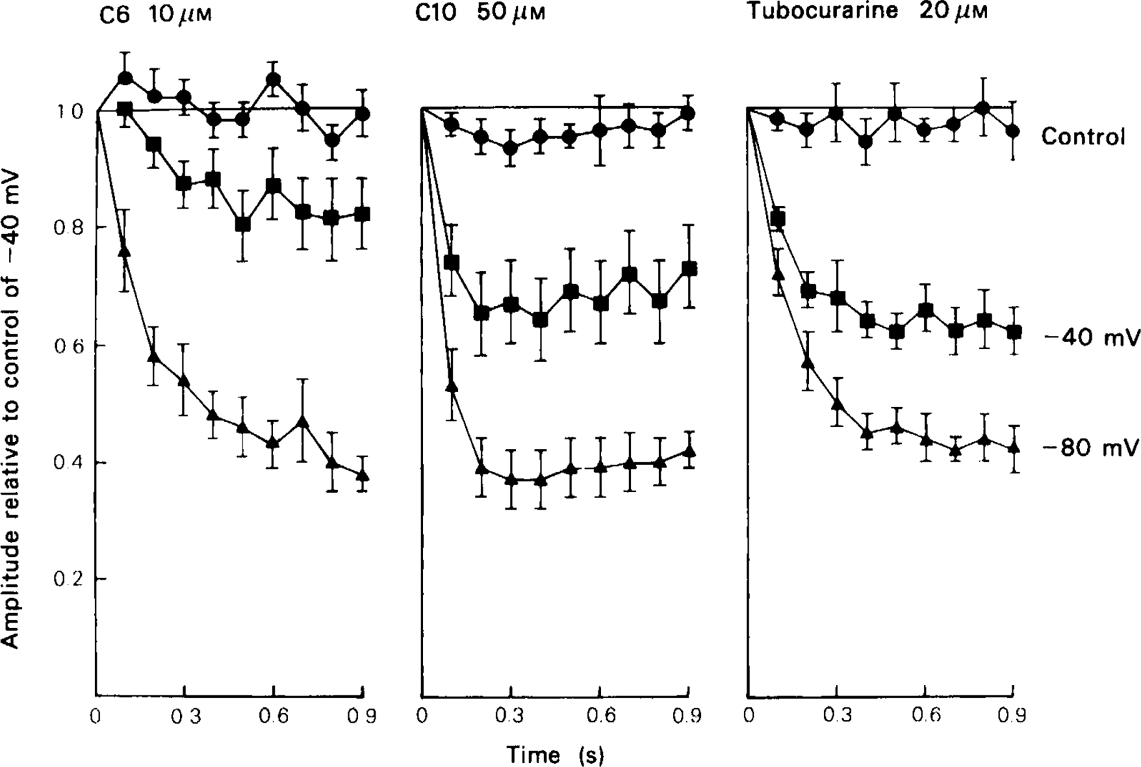
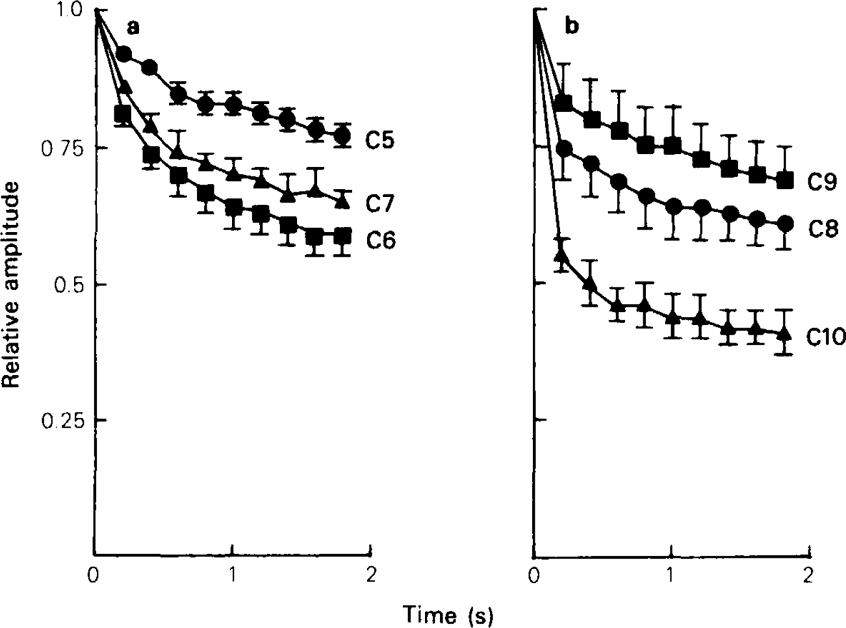
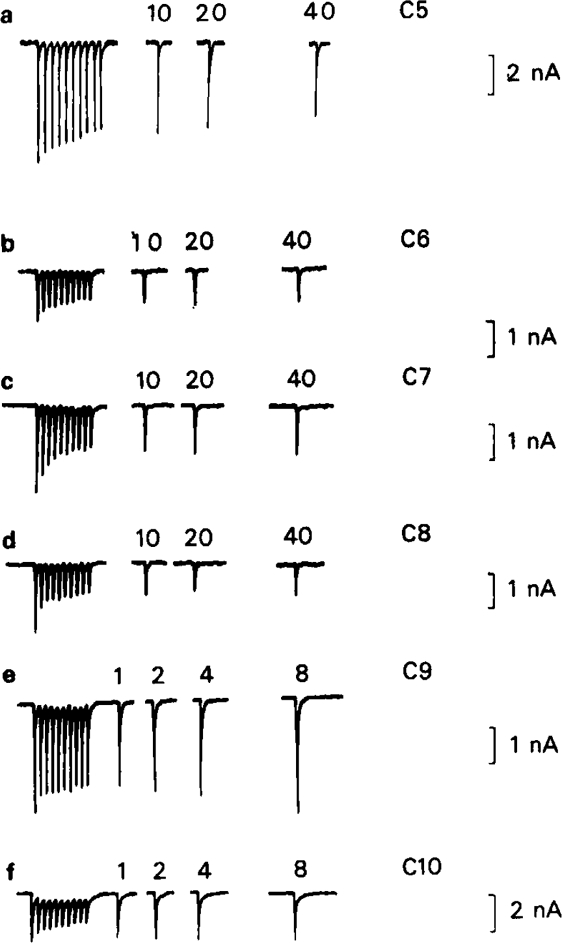
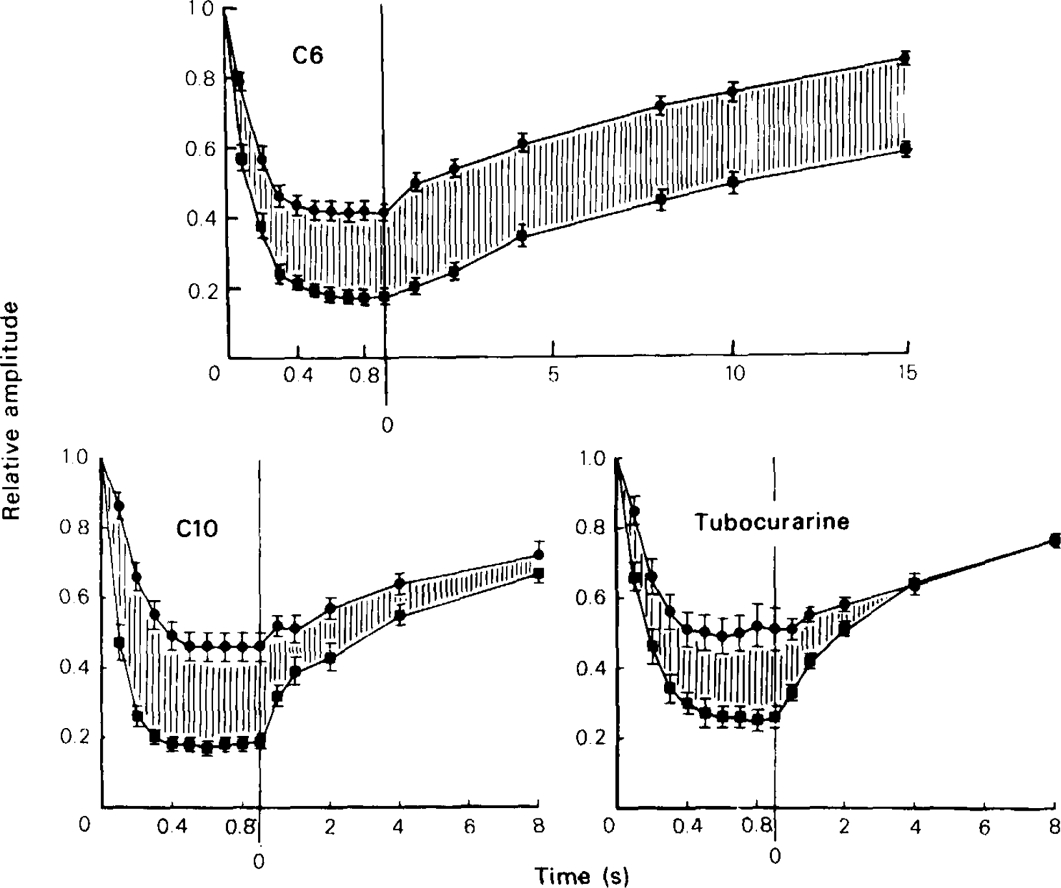
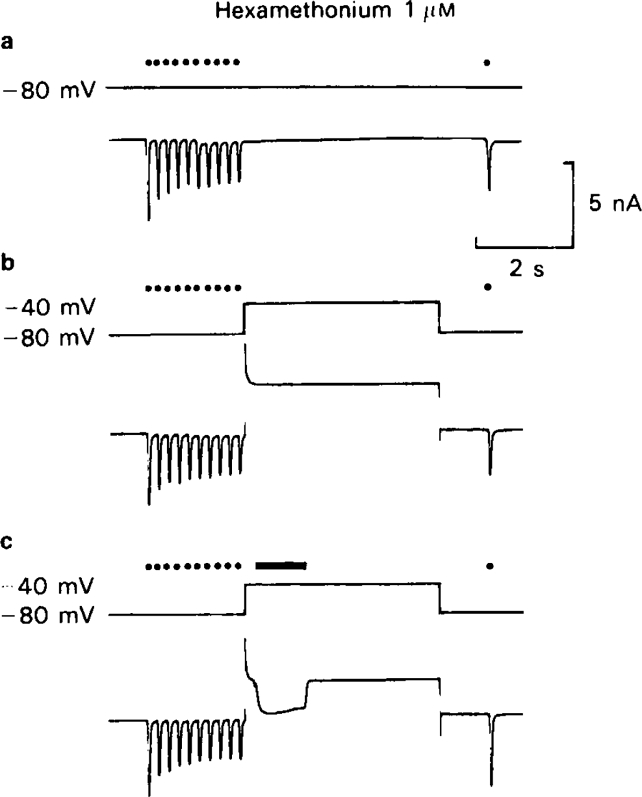
  3. All of the compounds produced use-dependent block when tested with short trains of stimuli at 10 Hz, or with trains of ionophoretic pulses of acetylcholine, consistent with their channel blocking property. Tubocurarine had a similar effect, but not trimetaphan or mecamylamine.

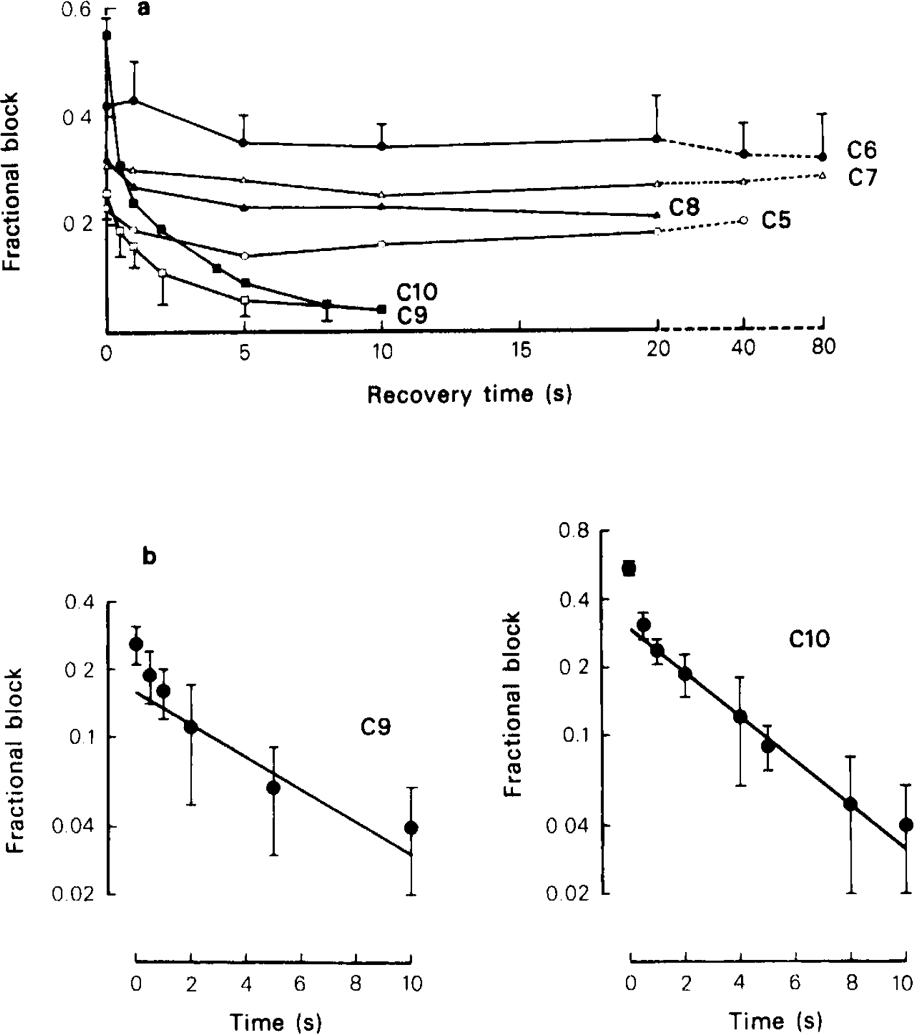
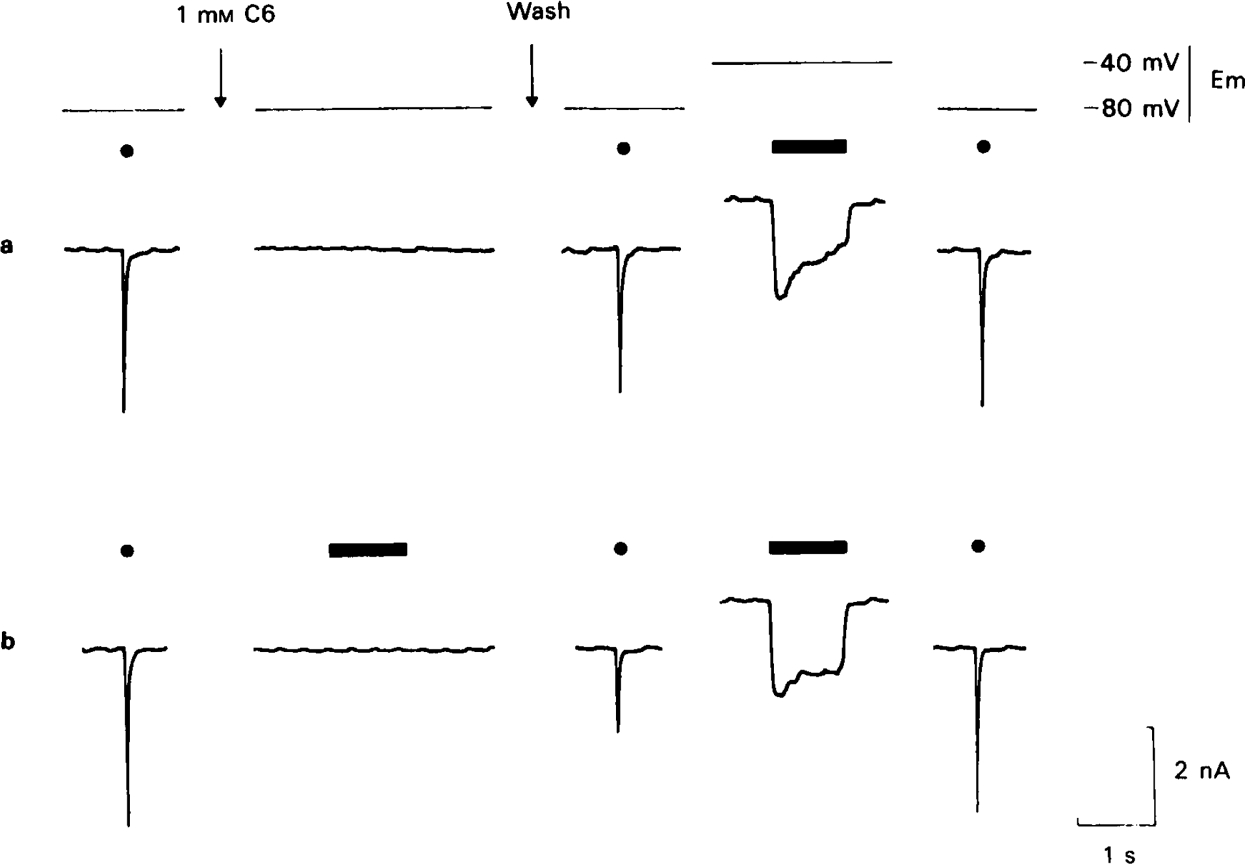
  4. Recovery from use-dependent block with short chain methonium compounds, up to C8, was very slow in the absence of agonist, being incomplete even after several minutes. With C9 or C10 or tubocurarine, recovery from use-dependent block was complete within a few seconds. With C6 recovery in the absence of agonist was unaffected by membrane potential, but could be accelerated by applying acetylcholine with the cell depolarized to − 40 mV. This persistent block was ascribed to the ability of the blocking molecule to become trapped by closure of the channel. With C9 and C10 it is assumed that their presence inhibits channel closure, so they can escape without the help of agonist.

  5. When use-dependent block is avoided by leaving the ganglion unstimulated during equilibration with the blocking drug, the first e.s.c. elicited shows no appreciable reduction of amplitude, though with C6, C7 or C8 subsequent responses elicited at 0.1 Hz become progressively more blocked.

  6. Even at 1 Mm, C6 does not prevent acetylcholine from opening ionic channels.

  7. It is concluded that all of the effects on e.s.c. amplitude can be interpreted in terms of channel block, there being no evidence of any receptor blocking action.


Figures

Figure 1
Figure 1
The effect of C5, C6 and C7 (20 μm in all cases) on the amplitude and decay kinetics of e.s.cs. In each pair of traces the lower record shows the e.s.c. (inward current being registered as a downward deflection) preceded by the stimulus artefact. The upper trace shows the e.s.c. plotted semi-logarithmically; points below an arbitrary level 2 log units below the peak have been suppressed and represented as a flat baseline to avoid an excessively noisy ‘tail’ to the semi-logarithmic plot. Noise has also been reduced by smoothing, with a running average procedure, applied to the tail region of the signal. Straight lines were fitted by eye to the slow component with the plots displayed on a graphics screen, the presence of a fast component being shown by the deviation of this line from the recorded signal at early times. The size of the fast component in this cell was unusually small and hard to resolve, but the effects of the blocking drugs on the slow component are clearly shown. Upper records: membrane potential −40 mV; lower records: membrane potential − 80 mV; calibrations: vertical: 1 decade; 20 nA. Horizontal: 50 ms. Note that in the controls hyperpolarization lengthens the slow component, whereas in the presence of C6 and C7 it has the opposite effect.
Figure 2
Figure 2
The effect of C8, C9 and C10 (20 μm in all cases) on e.s.cs, plotted as in Figure 1. C8 and C9 were tested on one cell, C10 on another. Upper records: membrane potential −40 mV; lower records: membrane potential − 80 mV. Calibrations: vertical: 1 decade; 20 nA. (The top of the 20 nA bar corresponds to zero holding current.) Horizontal: 50 ms. C8 produces a complex decay pattern, in which the exponential components cannot be resolved. C9 and C10 cause the appearance of a slow component, slower than either component of the control e.s.c., which is further lengthened by hyperpolarization. C9 caused an unusually large reduction of e.s.c. amplitude in this cell.
Figure 3
Figure 3
Analysis of e.s.cs recorded at − 80 mV in the presence of C9 (20 μm) and C10 (20 μm). The semi-logarithmic plots (as in Figures 1 and 2) can be split into 3 exponential components. The slow component was subtracted from the original trace (a) to produce trace (b). Trace (b) is still non-linear, implying that it consists of more than one exponential component. Straight lines have been plotted through the slowest component of traces (a) and (b).
Figure 4
Figure 4
The relationship between chain length and the rate constant for association with the fast channels, k+f, and the slow channels, k+s, in the methonium series: (○) (left hand ordinate): k+f; (▪) (left hand ordinate): k+s; (•) (right hand ordinate): measurements of ganglion blocking potency (C6 = 1) on the cat superior cervical ganglion in vivo, from Paton & Zaimis (1949). Downward arrows indicate values which represent upper limits.
Figure 11
Figure 11
Synaptic currents recorded at − 80 mV under control conditions and in the presence of methonium compounds at 20 μm. The stimulation frequency was 0.1 Hz. Note that with compounds up to C8 the rising phase of the e.s.c. was inhibited, whereas this did not happen with C9 or C10.
Figure 5
Figure 5
The effect of C6 (10 μm) on the run-down of e.s.c. amplitude during a 1 s train of stimuli at 10 Hz. At − 40 mV the degree of run-down occurring during the train was only slightly increased by C6, though the amplitude of the first e.s.c. in the train was reduced by about 50%. At − 80 mV the degree of run-down was clearly increased by C6. Note the different amplitude calibrations in the 4 traces.
Figure 6
Figure 6
E.s.c. run-down during a 1 s train at 10 Hz in the presence of C6 (10 μm), C10 (50 μm) and tubocurarine (20 μm). The points show mean for measurements on 6–8 cells, ± s.e.mean shown by vertical lines. For each cell the responses were normalised with respect to the corresponding response in the control train at − 40 mV, the amplitude of the first response in each train being taken as unity; (•) control responses –80 mV; (▪) test responses − 40 mV; (A) test responses − 80 mV. All three drugs increased the degree of run-down during the train, the effect being greater when the cell was hyperpolarized.
Figure 7
Figure 7
Effect of methonium compounds on the amplitude of responses to 2 ms, inophoretic pulses of ACh applied as a 2 s train of pulses at 5 Hz. Membrane potential − 80 mV. CS, C6 and C7 were tested at 1 μm; C8, C9 and C10 were tested at 10 μm. The peak amplitude of each response is expressed relative to the amplitude of the first response in each train, and each point represents the mean ± s.e.mean (vertical lines) for 4–6 cells.
Figure 9
Figure 9
Onset and recovery from use-dependent block elicited by a 2 s train of ionophoretic pulses of ACh (duration 2 ms at 5 Hz, in the presence of C5, C6 and C7 (1 μm), C8, C9 and C10 (10 μm). Membrane potential −80 mV. Each train was repeated several times to generate the complete recovery curve, as in Figure 8. The recovery interval is indicated on the test reponses. Use-dependent block was discharged after each test by application of a 1 s pulse of ACh with the cell clamped at − 40 mV (see Figure 13).
Figure 8
Figure 8
The kinetics of recovery from use-dependent block of e.s.cs at − 80 mV in the presence of C6 (20 μm), C10 (50 μm) and tubocurarin (20 μm). The left-hand section of each plot shows the decline of e.s.c. amplitude during a 1 strain of stimuli at 10 Hz, the upper curve (•) being the control and the lower curve (▪) being recorded in the presence of the drug. The response amplitude is normalised with respect to the first response in the train. The right-hand section shows the recovery time course, the abscissa being the interval between the end of the conditioning train and the application of a single test stimulus. To obtain the recovery curve, the conditioning train was repeated 5 or 6 times on each cell. The points show mean (vertical lines, s.e.mean) for 6–10 cells. The shaded area represents the degree of use-dependent block during the run-down and recovery periods. To discharge the use-dependent block fully after each test sequence a train of stimuli was applied with the cell clamped at − 40 mV (see text).
Figure 10
Figure 10
Kinetics of recovery following use-dependent block produced by a train of ionophoretic pulses of ACh (protocol as in Figure 9) at − 80 mV, in the presence of C5, C6, and C7 (1 μm), C8, C9, C10 (10 μm). (a) Overall results for 3–6 cells tested with each drug. Mean (s.e.mean shown by vertical lines) is given for C6 and C9; s.e.mean has been omitted from other curves for clarity, but was of similar magnitude in all cases. (b) Semi-logarithmic plots of recovery kinetics for C9 and C10 showing fast and slow phases. The lines fitted by eye to the slow phase correspond to time constants of 9.5 and 5.5 s respectively for C9 and C10. The time constant for the fast phase is not well defined, but appears to be less than 1 s for both drugs.
Figure 12
Figure 12
Synaptic currents recorded at − 80 mV under control conditions and in the presence of methonium compounds. C4 was tested at 200 μm, the other compounds at 20 μm. In each pair of traces the larger signal is the control e.s.c. recorded in the absence of drug and the smaller signal is the e.s.c. in the presence of drug. The upper row shows the first responses recorded after a rest of 5–8 min, during which the drug solution, or control solution, was perfused through the bath. The lower row shows responses recorded after the preparation had been stimulated for 1–2 min at 0.1 Hz.
Figure 13
Figure 13
The effect of membrane potential and ACh application on the rate of recovery from use-dependent block in the presence of C6 (1 μm). Use-dependent block was elicited by a train of ACh pulses as in Figure 9, and the recovery period before the test pulse was 5 s. (a) Membrane potential held at − 80 mV during recovery period. Very little recovery at 5 s (cf. Figure 10). (b) Membrane potential held at — 40 mV during recovery period. Very little recovery at 5 s. (c) Membrane potential held at − 40 m V while a 1 s pulse of ACh was applied during recovery period. Complete reversal of block.
Figure 14
Figure 14
Experiment to test whether C6 at high concentration prevents acetylcholine from opening channels. Traces marked (a) and (b) represent consecutive experiments on the same cell. Test responses to a standard 2 ms ionophoretic pulse of acetylcholine (ACh) are indicated by closed circles and 1 s pulses of ACh by horizontal bars. The membrane potential is shown on the upper trace. In sequence (a) C6 (1 Mm) was applied for 5 min and then washed out for 5 min before the second test response was elicited. The second test response shows only a very slight residual block. Application of a 1 s pulse of ACh with the cell depolarized to − 40 mV produces only a small increase in the test response. In sequence (b), the same procedure was followed except that a 1 s pulse of ACh was applied in the presence of C6. Though this pulse caused no discernible inward current, it enhanced the blocking effect of C6 considerably as shown by the reduced test response. Application of the unblocking procedure (1 s ACh pulse at − 40 mV) restored the test response fully, indicating that channel block was responsible for the effect.

Similar articles

References

    1. Adams DJ, Nonner W, Dwyer TM, Hille B. Block of end-plate channels by permeant cations in frog skeletal muscle. J. Gen. Physiol. 1981;78:593–615. - PMC - PubMed
    1. Adams PR. Drug blockade of open end-plate channels. J. Physiol. 1976;260:531–552. - PMC - PubMed
    1. Adams PR. Voltage jump analysis of procaine action at frog end-plate. J. Physiol. 1977;268:291–318. - PMC - PubMed
    1. Adams PR. Acetylcholine receptor kinetics. J. memb. Biol. 1981;58:161–174. - PubMed
    1. Adams PR, Feltz A. Quinacrine (mepacrine) action at frog end-plate. J. Physiol. 1980;306:261–281. - PMC - PubMed

MeSH terms

Substances

Personal name as subject