. 1997 May 13;94(10):5018-23.
doi: 10.1073/pnas.94.10.5018.

Cross-validated maximum likelihood enhances crystallographic simulated annealing refinement

Affiliations

Cross-validated maximum likelihood enhances crystallographic simulated annealing refinement

P D Adams et al. Proc Natl Acad Sci U S A. .

Abstract

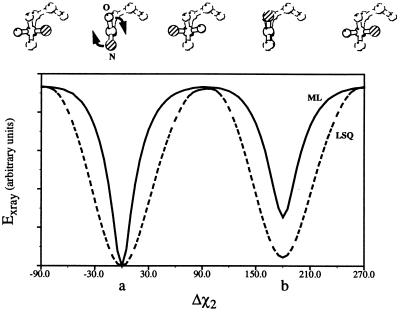
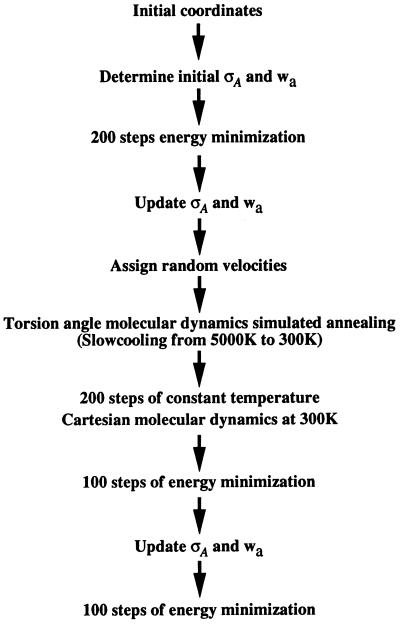
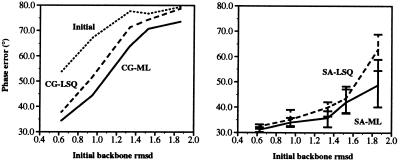
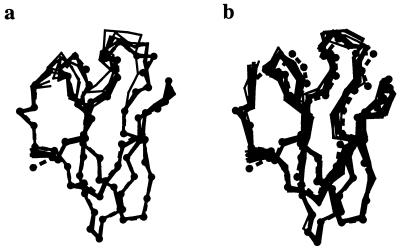
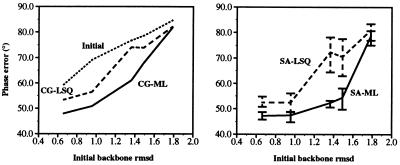
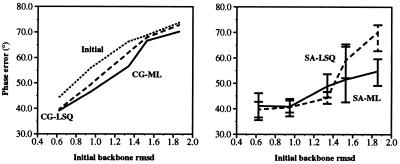
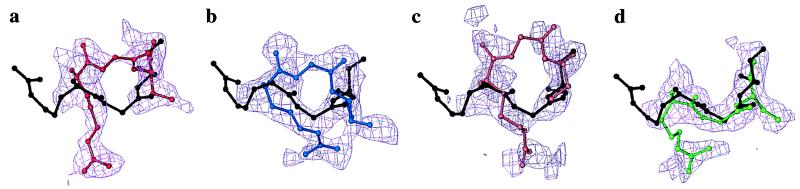
Recently, the target function for crystallographic refinement has been improved through a maximum likelihood analysis, which makes proper allowance for the effects of data quality, model errors, and incompleteness. The maximum likelihood target reduces the significance of false local minima during the refinement process, but it does not completely eliminate them, necessitating the use of stochastic optimization methods such as simulated annealing for poor initial models. It is shown that the combination of maximum likelihood with cross-validation, which reduces overfitting, and simulated annealing by torsion angle molecular dynamics, which simplifies the conformational search problem, results in a major improvement of the radius of convergence of refinement and the accuracy of the refined structure. Torsion angle molecular dynamics and the maximum likelihood target function interact synergistically, the combination of both methods being significantly more powerful than each method individually. This is demonstrated in realistic test cases at two typical minimum Bragg spacings (dmin = 2.0 and 2.8 A, respectively), illustrating the broad applicability of the combined method. In an application to the refinement of a new crystal structure, the combined method automatically corrected a mistraced loop in a poor initial model, moving the backbone by 4 A.


Figures

Figure 1
Figure 1
A comparison of the energy landscapes of the least-squares residual (dashed line) and the maximum likelihood target (solid line). An asparagine residue was placed in a P1 unit cell of size a = 40 Å, b = 40 Å, and c = 40 Å. Diffraction data from 20- to 2-Å resolution were calculated from the structure in its initial conformation. These data were modified by addition of Gaussian error (± 10% of |F|). A single value of σF, 10% of the average amplitude, was used for all reflections. The χ2 dihedral was then rotated in 5° steps, and the value of the x-ray target (Eqs. 1 and 4), compared with the model diffraction data, was calculated at each position. The two minima correspond to the correct solution (a) and a false minimum with the positions of OD1 and ND2 inverted (b). The maximum likelihood target clearly shows sharper minima, broader, flatter maxima, and a less deep false minimum.
Figure 2
Figure 2
Automated torsion angle dynamics simulated annealing protocol for maximum likelihood-based refinement. Refinements with the maximum likelihood target calculated initial σA values that were used through an initial 200 conjugate gradient minimization steps, after which the estimates of σA and the weight (wa) were updated. Torsion angle molecular dynamics in combination with simulated annealing started from a temperature of 5,000 K and decreased in 25 K steps to 300 K, and 12 steps of dynamics with a timestep of 2 fs were carried out for each temperature drop. After torsion angle molecular dynamics 200 steps of Cartesian molecular dynamics were carried out at a constant temperature of 300 K followed by 100 steps of conjugate gradient minimization. A final 100 steps of minimization were performed after a final update of the σA and wa values.
Figure 3
Figure 3
Final phase error for the least-squares residual target, Eq. 1 (dashed line), and the maximum likelihood target, Eq. 4 (solid line), for refinements of the scrambled amylase inhibitor structures against diffraction data at dmin = 2.0 Å, with respect to the published crystal structure. (Left) Results for conjugate gradient minimization. (Right) Results for 10 simulated annealing runs with torsion angle dynamics. The simulated annealing graph shows the average of 10 refinements with different initial velocities. Error bars indicate the maximum and minimum phase errors obtained with 10 simulated annealing runs. The best structures are readily identified by the lowest free R-value. Initial phase errors are shown by the upper dotted line.
Figure 4
Figure 4
(a) Result of 10 simulated annealing refinements with the maximum likelihood target (solid lines), compared with the published amylase inhibitor crystal structure (dashed line with Cα atoms shown as solid circles). (b) Same results for 10 refinements with the least-squares residual. The starting model has an rms deviation of 1.9 Å from the published crystal structure. This figure was created with the program molscript (30).
Figure 5
Figure 5
Final phase error for the least-squares residual target, Eq. 1 (dashed line), and the maximum likelihood target, Eq. 4 (solid line), for refinements of the scrambled amylase inhibitor structures against lower resolution diffraction data at dmin = 2.8 Å (see text), with respect to the published crystal structure. (Left) Results for conjugate gradient minimization. (Right) Results for 10 simulated annealing runs with torsion angle dynamics. The simulated annealing graph shows the average of 10 refinements with different initial velocities. Error bars indicate the maximum and minimum phase errors obtained with 10 simulated annealing runs. The best structures are readily identified by the lowest free R-value. Initial phase errors are shown by the upper dotted line.
Figure 6
Figure 6
Final phase error for the least-squares residual target, Eq. 1 (dashed line), and the maximum likelihood target, Eq. 4 (solid line), for refinements of the poly-alanine only scrambled amylase inhibitor structures against diffraction data at dmin = 2.0 Å, with respect to the published crystal structure. (Left) Results for conjugate gradient minimization. (Right) Results for 10 simulated annealing runs with torsion angle dynamics. The simulated annealing graph shows the average of 10 refinements with different initial velocities. Error bars indicate the maximum and minimum phase errors obtained with 10 simulated annealing runs. The best structures are readily identified by the lowest free R-value. Initial phase errors are shown by the upper dotted line.
Figure 7
Figure 7
Electron density maps for a loop region of human hnRNP A1 comprising residues 141–143 (all maps σA weighted and contoured at 1.0 σ). In all cases, the final refined structure is shown in black. (a) Best model (shown in red) from five simulated annealing refinements using the least-squares target. The connected density in the region of the model and the broken density in the region of the correct solution is due to model bias. (b) Model (shown in blue) from conjugate gradient minimization using the maximum likelihood target. Reduced model bias due to the maximum likelihood target results in connected electron density in the region of the correct solution. (c) Representative model (shown in orange) from five simulated annealing refinements using the maximum likelihood target. The combination of torsion angle simulated annealing and the maximum likelihood target reduces model bias even further. (d) Best model (shown in green) from five simulated annealing refinements using the maximum likelihood target. The correct placement of the residues has been automatically achieved. These images were created with the program o (31).

References

    1. Hendrickson W A. Methods Enzymol. 1985;115:252–270. - PubMed
    1. Tronrud D E, Ten Eyck L F, Matthews B W. Acta Crystallogr A. 1987;43:489–500.
    1. Jack A, Levitt M. Acta Crystallogr A. 1978;34:931–935.
    1. Brünger A T, Kuriyan J, Karplus M. Science. 1987;235:458–460. - PubMed
    1. Gros P, Betzel C, Dauter Z, Wilson K S, Hol W G J. J Mol Biol. 1989;210:347–367. - PubMed

Publication types

LinkOut - more resources