

Population regulation in snowshoe hare and Canadian lynx: asymmetric food web configurations between hare and lynx
- PMID: 9144205
- PMCID: PMC24646
- DOI: 10.1073/pnas.94.10.5147
Population regulation in snowshoe hare and Canadian lynx: asymmetric food web configurations between hare and lynx
Abstract
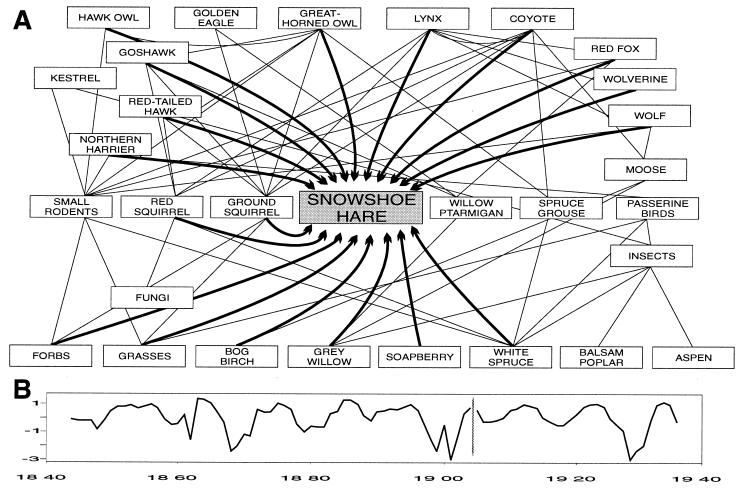
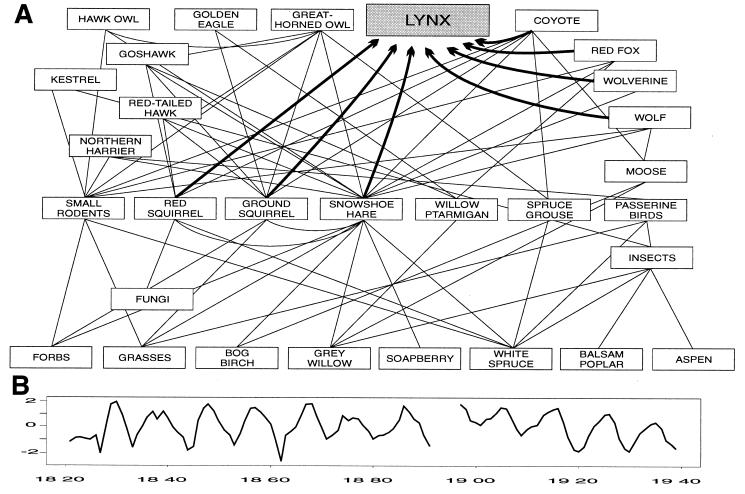
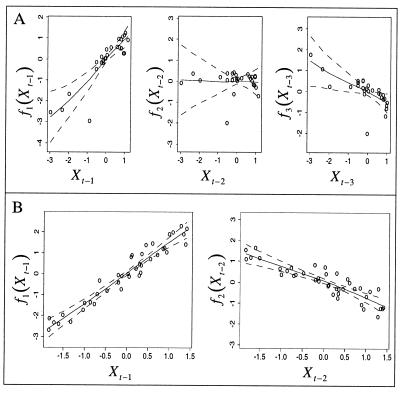
The snowshoe hare and the Canadian lynx in the boreal forests of North America show 9- to 11-year density cycles. These are generally assumed to be linked to each other because lynx are specialist predators on hares. Based on time series data for hare and lynx, we show that the dominant dimensional structure of the hare series appears to be three whereas that of the lynx is two. The three-dimensional structure of the hare time series is hypothesized to be due to a three-trophic level model in which the hare may be seen as simultaneously regulated from below and above. The plant species in the hare diet appear compensatory to one another, and the predator species may, likewise, be seen as an internally compensatory guild. The lynx time series are, in contrast, consistent with a model of donor control in which their populations are regulated from below by prey availability. Thus our analysis suggests that the classic view of a symmetric hare-lynx interaction is too simplistic. Specifically, we argue that the classic food chain structure is inappropriate: the hare is influenced by many predators other than the lynx, and the lynx is primarily influenced by the snowshoe hare.
Figures
References
-
- Elton C S. Voles, Mice and Lemmings. Oxford, U.K.: Clarendon; 1942.
-
- Elton C S, Nicholson M. J Anim Ecol. 1942;11:215–244.
-
- Keith L B. Wildlife’s Ten-Year Cycle. Madison: Univ. of Wisconsin Press; 1963.
-
- Krebs C J, Boutin S, Boonstra R, Sinclair A R E, Smith J N M, Dale M R T, Martin K, Turkington R. Science. 1995;269:1112–1115. - PubMed
-
- Krebs C J. Ecology: The Experimental Analysis of Distribution and Abundance. 4th Ed. New York: Harper Collins; 1994.
Publication types
MeSH terms
LinkOut - more resources
Full Text Sources
Miscellaneous
