Comparative Study
. 1997 May 13;94(10):5213-8.
doi: 10.1073/pnas.94.10.5213.

Clustering of meiotic double-strand breaks on yeast chromosome III

Affiliations
Free PMC article
Comparative Study

Clustering of meiotic double-strand breaks on yeast chromosome III

F Baudat et al. Proc Natl Acad Sci U S A. .
Free PMC article

Abstract

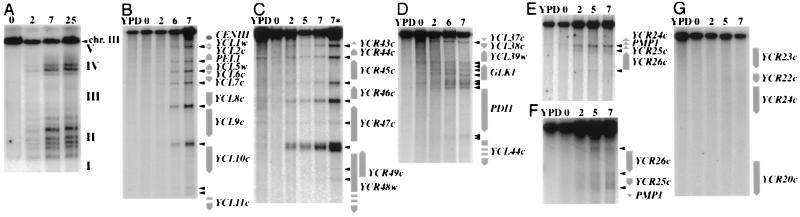
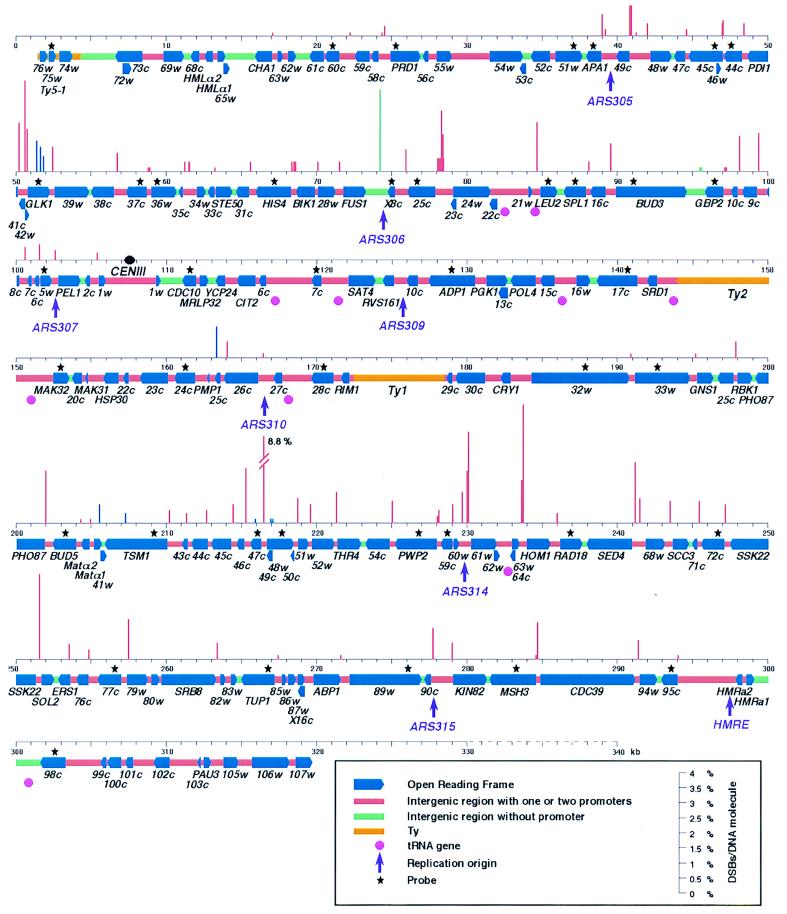
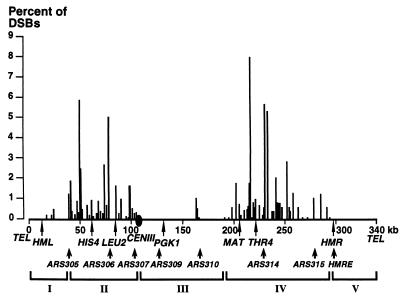
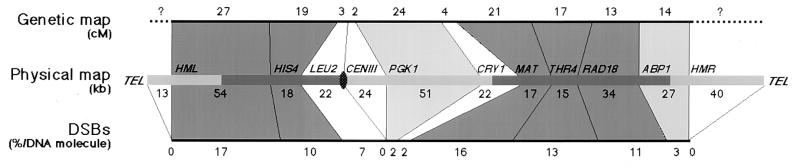
In the yeast Saccharomyces cerevisiae, meiotic recombination is initiated by transient DNA double-strand breaks (DSBs) that are repaired by interaction of the broken chromosome with its homologue. To identify a large number of DSB sites and gain insight into the control of DSB formation at both the local and the whole chromosomal levels, we have determined at high resolution the distribution of meiotic DSBs along the 340 kb of chromosome III. We have found 76 DSB regions, mostly located in intergenic promoter-containing intervals. The frequency of DSBs varies at least 50-fold from one region to another. The global distribution of DSB regions along chromosome III is nonrandom, defining large (39-105 kb) chromosomal domains, both hot and cold. The distribution of these localized DSBs indicates that they are likely to initiate most crossovers along chromosome III, but some discrepancies remain to be explained.


Figures

Figure 1
Figure 1
Experimental detection of meiotic double-strand breaks on chromosome III. (A–G) DNA was extracted from ORD1181 grown either in rich medium (yeast extract/peptone/dextrose, YPD) or after transfer into sporulation medium for various times (0, 2, 5, 6, or 7 h). (A) Detection of chromosome III DSBs by DNA pulsed-field gel electrophoresis and Southern blot analysis and probing with YCL60c (see Fig. 2 for position). I–V represent the five DSB domains: left end DSB-poor (I), left arm DSB-rich (II), internal DSB-poor (III), right arm DSB-rich (IV), and right end DSB-poor (V) domains. Bio-Rad clamped homogeneous electric fields (CHEF) electrophoresis conditions: 180 V, 5- to 30-sec pulses, 38 h, 1.1% agarose gel in 0.5× TBE. (B–G) Detection of chromosome III DSBs by standard electrophoresis and Southern blot analysis; (B) YCL11c-CENIII interval probed with YCL11c (GBP2) (Psp5II); (C) YCR43c-YC48w interval probed with YCR48w (AseI digest). Lanes 7 and 7* correspond to DNA from two independent sporulations; (D) GLK1 region probed with YCL45c (XbaI digest); (E and F) YCR24c-YCR27c interval probed with YCR32w or YCR24c, respectively (EagI); and (G) YCR20c-YCR23c interval probed with YCR19w(PvuII). Vertical arrows indicate genes or ORFs predicted by the DNA sequence (22). Arrowheads indicate the positions of meiotic DSBs.
Figure 2
Figure 2
Location and amount of meiotic DSBs on chromosome III. For simplification, the ORF numbers (22) are indicated without YCL or YCR. The physical map is drawn to scale from the sequence (coordinates are in kb) and is corrected for the major differences found in ORD1181 derived from SK1 that lead chromosome III to a length of 340 kb instead of 315 kb in the published sequence (22): Ty2–17 near LEU2 is absent, as is the delta LTR between YCR6c and YCR7c; a Ty2 identified by PCR amplification and restriction analysis is inserted at coordinate 151,000; a Ty1 is inserted between RIM1 and YCR29c (25); additional 396 bp are in YCR89w; the right chromosomal end is 15–25 kb longer and of unknown sequence. Bar height represents the percent of meiotic DSBs per DNA molecule. Generally, two measurements were made at each region, with different restriction digests and probes. Standard errors between different measurements of the same DSB sites depend on the DSB frequencies: 0.05–0.2% for DSB ≤ 0.5%, 0.2–0.5% for DSB between 0.5% and 1.5%, and 0.5–1% for DSB > 1.5%. Red, green, and blue bars represent DSBs in intergenic-promoter, intergenic terminators, and coding regions, respectively. Other information is provided in the legend box. The probes (ORF name, coordinates on chromosome III sequence) and the various single restriction digests used are as follow: Ty5–1 (2,044–2,881), SmaI, PpuMI; L60c (20,905–21,308), BglII, Psp5II, FspI, NsiI; L57w (25,667–26,104), BamHI, Psp5II, StuI; L51w (37,222–37,603), NruI, DraIII, AvrII; L50c (37,870–38,427), Psp5II; L45c (46,155–46,731), SalI, XbaI; L44c (47,229–47,639), PstI; L37c (58,303–58,728), SalI; L36w (59,350–59,918), XbaI, BamHI; HIS4 (64,862–65,971), SalI, XbaI; HIS4 (66,402–67,581), HpaI; LX8c (74,841–75,300), BspHI; L25c (77,036–77,612), XbaI, Bsu36I; LEU2 (91,646–92,260), BstEII, PstI; SPL1 (93,205–93,771), PstI; BUD3 (96,872–97,621), DraIII; GBP2 (102,136–102,809), HindIII, Psp5II;L5w (107,950–108,386), NdeI, BclI; CDC10 (117,167–117,837), XhoI, EcoRV; R7c (125,703–126,220), Tth111I, XhoI; ADP1 (135,227–135,681), PvuI, BglI; R17c (145,930–146,751), ApaLI, BlpI; MAK32 (159,990–153,448), EcoNI, PvuII; R24c (161,088–161,452), EcoRI, NsiI, ScaI, EagI; FEN2 (170,327–170,967), EagI, XhoI; R32w (179,254–180,256), PstI, SacI, BamHI; R33w (186,230–187,326), XhoI, SacI; BUD5 (196,447–197,353), AatII, PmlI; TSM1 (202,617–203,464), BclI, KpnI; R47c (209,451–210,119), XbaI; ARE1 (210,981–212,598), AseI; CTR86 (217,182–217,837) XbaI; R59c (222,343–222,825), ApaLI, EcoNI; RAD18 (230,349–230,967), SalI, Bsu36I; R72c (239,598–240,466), BamHI, PacI; R77c (250,130–250,608), EcoNI, AatII; TUP1 (259,636–260,424), BamHI, EcoRI; R89w (269,902–270,364), KpnI, DraIII; MSH3 (277,837–278,335), AvaI, Bsu36I; R95c (287,179–287,644), SphI, AvrII, BspEI; R98c (296,513–297,075), SalI, BamHI, HindIII, MluI.
Figure 3
Figure 3
Chromosomal organization of DSB regions and other chromosomal features. Summary map of the location and amount of DSBs along the chromosome III. The height of the vertical bars corresponds to the sum of the frequencies of DSBs per intergenic or coding region. The arrows indicate the location of well known genes and functional replication origins (ARS and HMRE) (refs. and ; C. Newlon, personal communication).
Figure 4
Figure 4
Comparisons between the genetic and physical distances and the amount of meiotic DSBs for 12 intervals of chromosome III. Genetic distances are from Mortimer et al. (42), and physical distances are as in Fig. 2. The percent of DSBs was calculated as the sum of all DSBs in each interval. Domains with and without DSBs are represented on the physical map by ▪ and ░⃞, respectively. Differently shaded areas represent regions of chromosome III where frequencies of crossovers and DSBs are correlated at high (▪) or low (□) levels, or poorly correlated (░⃞).

References

    1. Lichten M, Goldman A S H. Annu Rev Genet. 1995;29:423–444. - PubMed
    1. Roeder G S. Proc Natl Acad Sci USA. 1995;92:10450–10456. - PMC - PubMed
    1. Kleckner N. Proc Natl Acad Sci USA. 1996;93:8167–8174. - PMC - PubMed
    1. Sun H, Treco D, Szostak J. Nature (London) 1989;338:87–90. - PubMed
    1. Alani E, Padmore R, Kleckner N. Cell. 1990;61:419–436. - PubMed

Publication types

LinkOut - more resources